
Table of Contents
In 2023, the global economy is grappling with persistent high inflation. The Federal Reserve (FED) has been raising interest rates since March 2022, with ten consecutive rate hikes until May 4, 2023. The benchmark interest rate has been elevated to 5% / 5.25%, the highest level since August 2007. As interest rates soar, the bond market has witnessed the largest net inflow of funds in history. Consequently, the US bond yield curve has experienced the most significant inversion in 40 years. This article will introduce various bond-related terms, explore the reasons behind the inverted yield curve, and discuss the recent surge in popularity of bond ETFs, providing you with a deeper understanding of these financial instruments before venturing into bond investments.
Before we get into the topic, it is important to understand what bonds are. With an understanding of the characteristics of bond and related terminology, it will be easier to comprehend the reasons and significance of an inverted yield curve.
Firstly, bonds are fixed-income financial instruments that provide returns through periodic interest payments, as well as the principal amount at maturity. In general, bond investors prioritize the stability of regular interest payments (though not always works) rather than high capital gains. Therefore, when purchasing bonds, we often encounter various terms related to interest rates, such as coupon rate and yield to maturity. Here, TEJ has compiled explanations of important bond-related terms for your reference:
So far, we understand that bond prices usually differ from their face values and are influenced by the coupon rate and market interest rates. Among these, the most important rate is “yield to maturity (YTM)”, which is also the rate referred to in the concept of an inverted yield curve.
In general, when market interest rates rise, investors tend to sell bonds because the bond’s returns (yield to maturity) become less attractive. This leads to a decline in bond prices until the yield to maturity reaches a reasonable range (market interest rate + risk premium).
Typically, long-term government bonds carry higher risks because investors demand higher risk premiums. If this is not the case, it is referred to as an inverted yield curve.
For many years, the market has typically used the difference between the 10-year bond yield and the 2-year bond yield as an indicator for observing an inverted yield curve. If the yield spread is less than zero or negative, it indicates an inverted yield curve. But in recent years, the U.S. Federal Reserve (Fed) has also used the difference between the 10-year bond yield and the 3-month bond yield. This is because the 3-month bond yield, with its shorter maturity and better liquidity, can better reflect changes in policy rates.
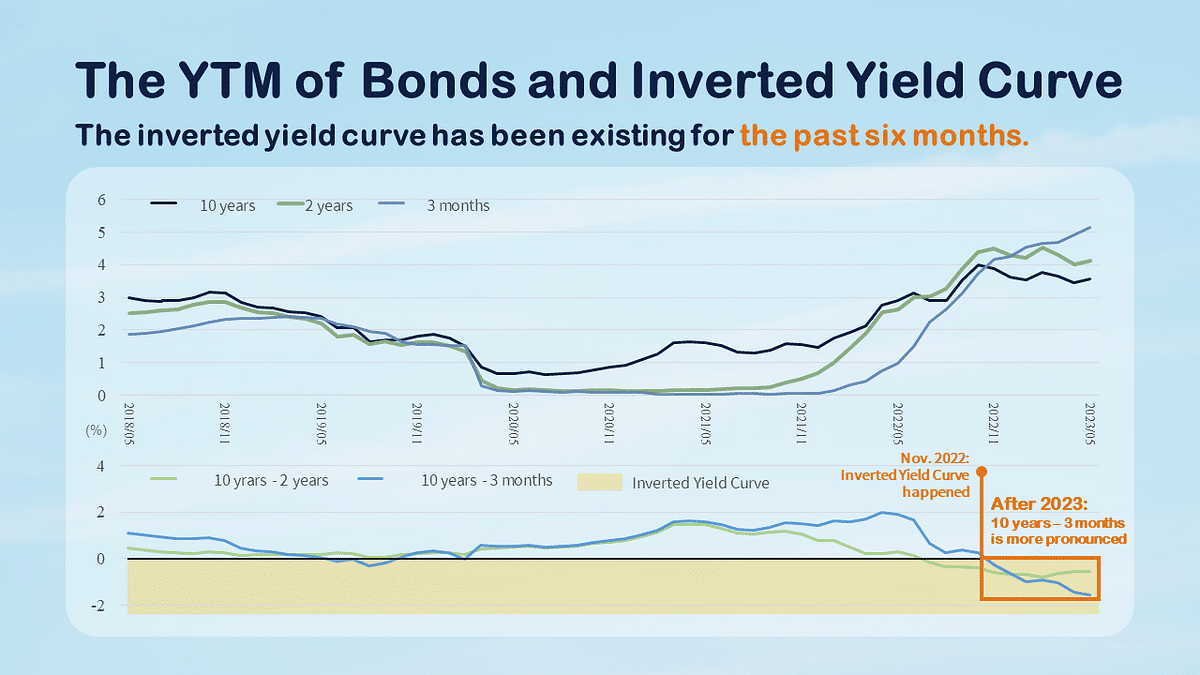
The chart above compares the yield curves of the 10-year and 2-year Treasury bonds, along with the 3-month Treasury bond, as well as their yield spreads. It can be seen that both the 10-year and 2-year yields have inverted since November 2022, and after the beginning of 2023, the yield spread between the 10-year and 3-month bonds has shown a more pronounced gap compared to the 10-year and 2-year spread.
Recently, the US Consumer Price Index (CPI) in April reaching a two-year low, and the latest GDP for the first quarter of 2023 at 1.1%. After several bank crises, the Fed finally removed the phrase “ongoing increases”. After raising the benchmark interest rate to 5%-5.25%. Market expectations indicate that interest rates have reached their peak, and the possibility of an interest rate hike in June is low.
At the same time, the Fed also acknowledges the possibility of a US economic recession occurring in the second half of this year, as the severity of the yield curve inversion in US bonds is the highest since the 1980s.
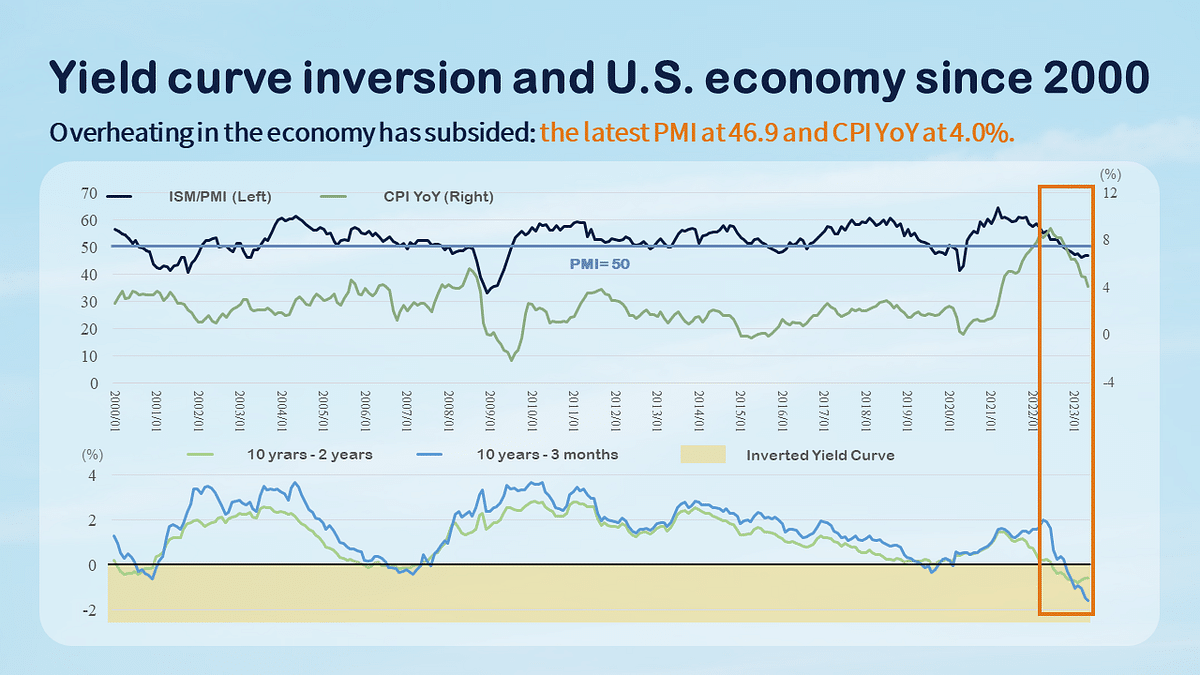
From the chart, we can observe that when the gap of the yield curve inversion widens, there is a phenomenon of the ISM (Purchasing Managers’ Index) falling below the 50-point threshold. After falling below 50 in October 2022, it has remained sluggish, reaching 46.9 in May 2023. During the same period, the CPI YoY increase dropped from 8.2% to 4.0%, and the Fed raised the benchmark interest rate to 5.25%.
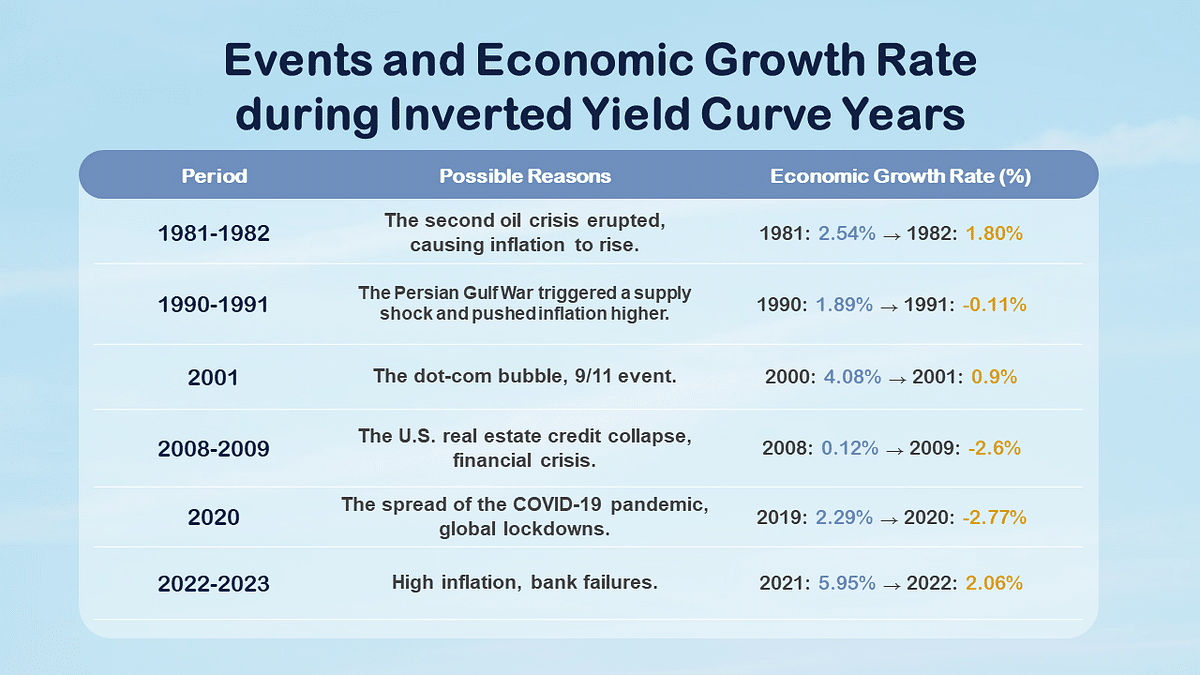
Furthermore, the table below shows the years in the past forty years when the yield curve inverted in the United States. It is not difficult to notice that economic recessions often follow the occurrence of an inverted yield curve. Based on the IMF’s statement in April 2023, which indicated high inflation and financial institution turmoil, the global economic growth rate for 2023 is forecasted at 2.8%, and the US annual economic growth rate for 2023 is projected to be 1.6%. The US economy is on the verge of an impending recession.
The US Federal Reserve has reached a high point in its benchmark interest rate, and market expectations for interest rate hikes are nearing their end. Factors such as increased demand for hedging among investors have led to a preference for government bonds and high-grade bonds at the beginning of this year. Bond ETFs, in particular, have experienced unstoppable momentum.
Even though the recent period may be a good buying opportunity for bond ETFs, it’s important to note that bond ETFs are not risk-free. When choosing to purchase bond ETFs, it is essential to be aware of the following risks:
TEJ has compiled the data of bond ETFs and listed the following four funds that have lower risk levels but still exhibit favorable performance in terms of returns.
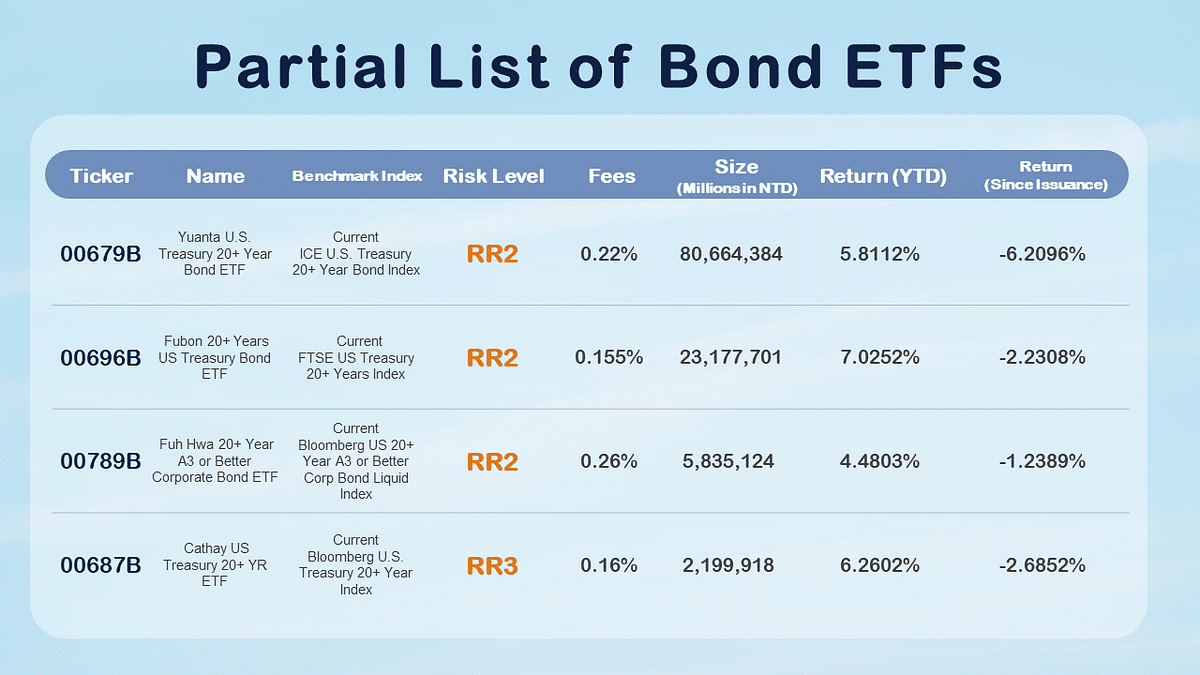
※ This table is for reference only and does not represent any recommendations or advice regarding specific products or investments.
Through this article, we hope to provide readers with a better understanding of recent interest rate policies, bonds, and bond ETFs. Furthermore, even though interest rate hikes are nearing their end, it is impossible to predict the future direction of the Federal Reserve’s rate policies. Investing in bonds and bond ETFs still carries risks. We urge investors to thoroughly understand the investment targets and their own risk profiles before investing. It is also important to pay attention to potential premium in ETFs resulting from market overheating. With a deeper understanding, investors can make more informed decisions when investing in financial products.
Read More:
Want to know more?
TEJ TAIWAN DB → TESG Profile → Macroeconomics → CA 14, CA15, CA26, CA31, CA2402, CA34, CA2138
Access the latest macroeconomic and interest rate data through the TEJ Profile, keeping you up-to-date with global economic trends!
If you have any questions about this article or want to obtain further access to the TEJ database, please feel free to leave a comment, call, or mail us.
About us
⭐️ TEJ Website
⭐️ LinkedIn
✉️ E-mail: tej@tej.com.tw
☎️ Phone: +886–2–87681088
