
Table of Contents
Previous research on price momentum has found a positive correlation between the 26-week price deviation rate and future stock returns in the U.S. stock market. Jegadeesh and Titman identified a momentum effect in the U.S. stock market – buying stocks with the best past 6-12 months returns while simultaneously selling stocks with the worst past 6-12 months yielded significant excess returns economically and statistically. Subsequent studies by many scholars have also found that momentum effects are prevalent in international stock markets and across different asset classes.
In recent years, regulatory efforts to enhance information disclosure in the stock market, coupled with gradual relaxations in the volatility of stock market fluctuations, have rapidly increased the efficiency of the Taiwan stock market. Therefore, it is worth further examining the relationship between price momentum and expected stock returns in the Taiwanese stock market. To explore this relationship, academia and industry have developed numerous indicators to measure stock momentum. In addition to indicators based on past cumulative returns, there are also indicators utilizing volatility-adjusted cumulative stock returns, moving average divergences, CAPM residuals’ cumulative values, Etc. This article will use our previous research findings:
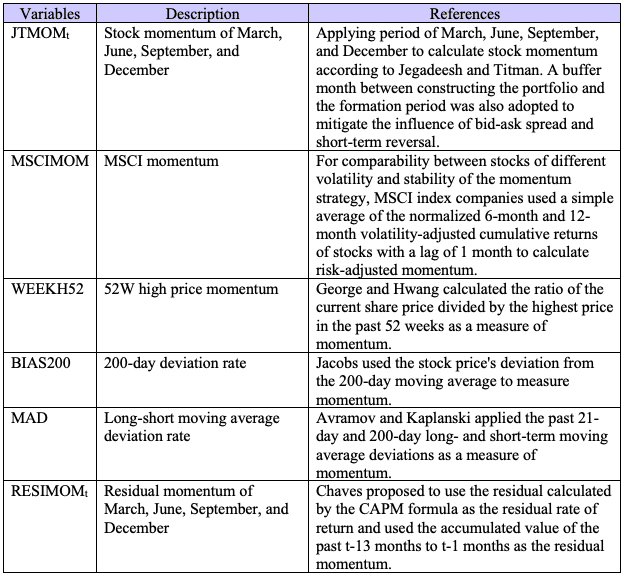
Hence, this article will primarily utilize JTMOM3 and MAD momentum variables for backtesting analysis.
For more detailed information, please refer to The Relationship between Price Momentum and Expected Stock Returns.
This article uses MacOS and Jupyter Notebook as the editor.
The data period ranges from 2018-02-01 to 2023-12-31. Forty stocks are randomly selected, and the Taiwan Weighted Index (IX0001) is included as the market benchmark.
The Custom Factor allows users to design their desired customized factors. In this case, we will use it to handle:
A 3-month momentum factor (Momentum, details can be found in Custom Factors).
The Pipeline() function allows users to quickly process quantitative indicators and price-volume data for multiple targets. In this case, we will use it to handle:
WeightedMovingAbsDev; details can be found in Pipeline built-in factors).window_length MAD is set to 21 days for the short term and 120 days for the long term.High is True, it indicates the top 8 performing stocks in terms of returns, whereas when Low is True, it indicates the bottom eight performing stocks. (Users can choose to trade only two stocks per 5% of the 40 stocks, but expanding the stock pool is recommended; otherwise, the number of traded stocks will be too small. Here, we will calculate using eight stocks each.)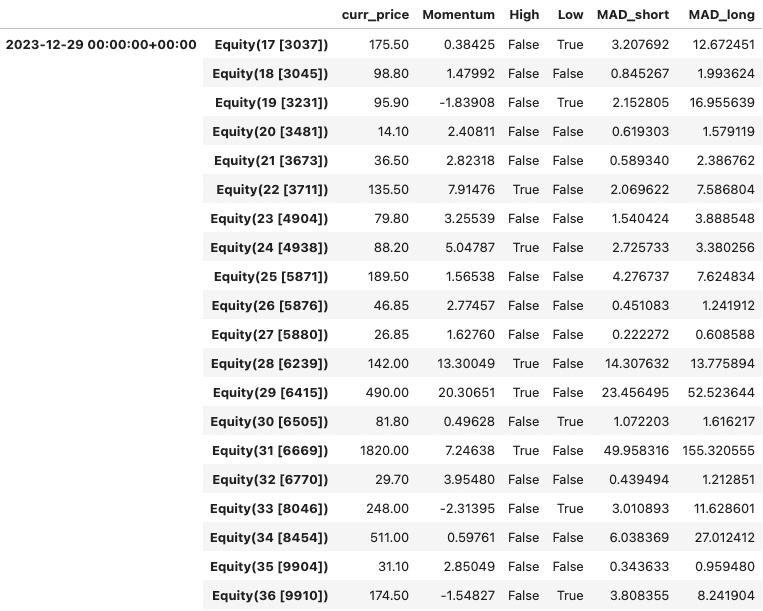
Start Building Portfolios That Outperform the Market!
The initialize() Function is used to define the daily trading environment before the start of trading. In this example, we set:
The handle_data() function is critical for constructing the price momentum factor strategy. It is called daily after the start of backtesting and is mainly responsible for setting trading strategies, placing orders, and recording trading information.
For detailed trading rules of this strategy, please refer to Momentum Factor.ipynb
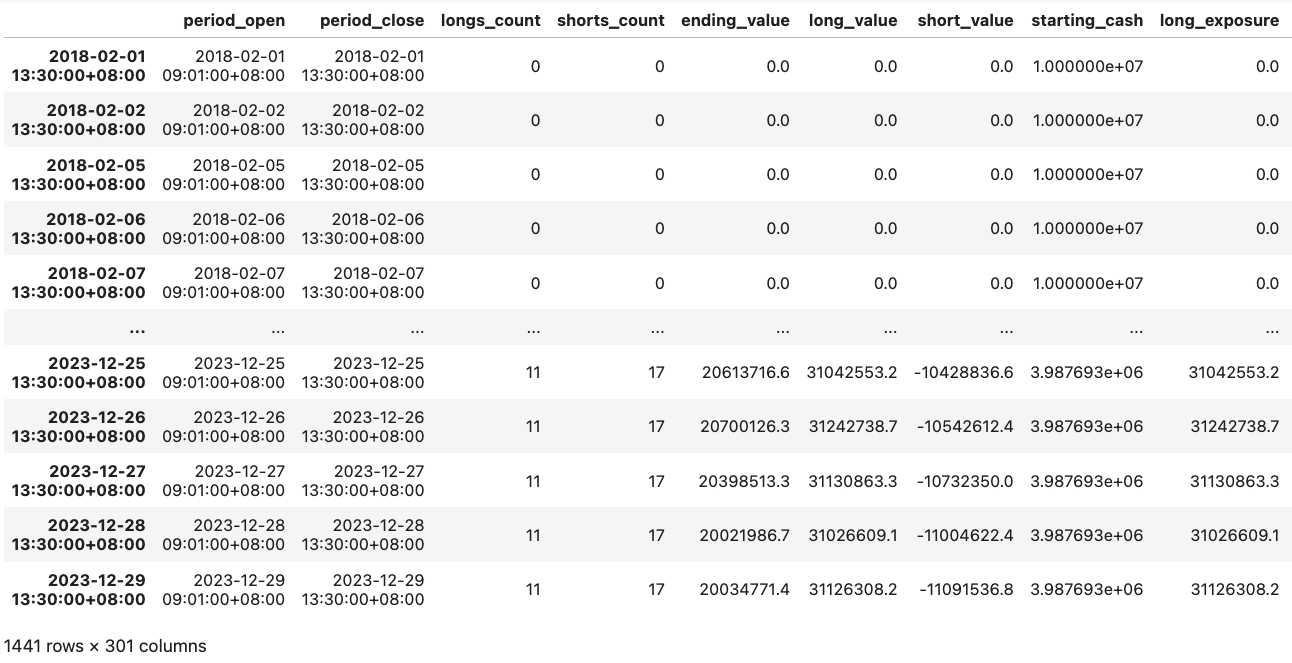
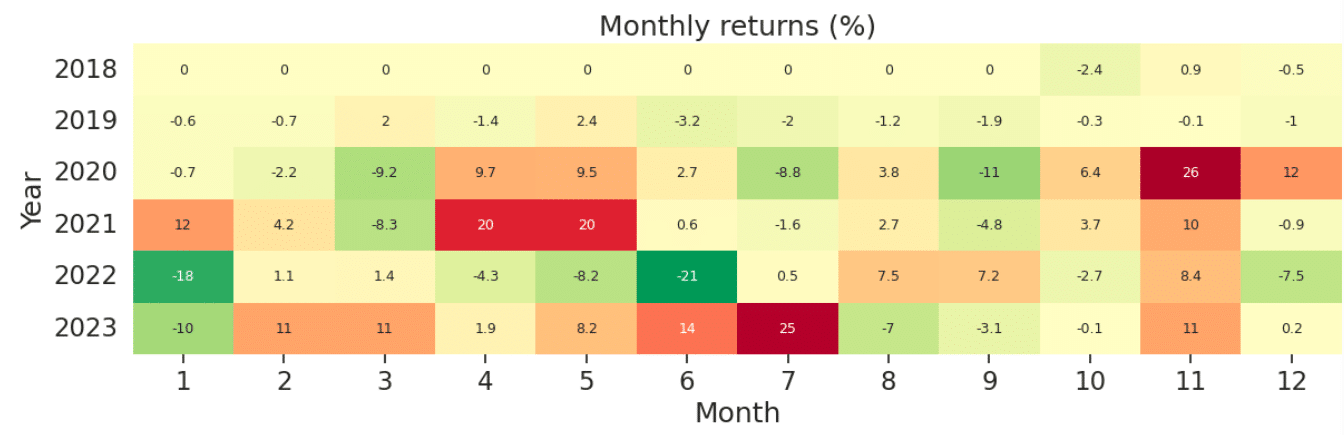
Run_algorithm() is used to execute the momentum factor strategy as configured. The trading period is set from start_dt (2018-02-01) to end_dt (2023-12-31), using the dataset tquant, with initial capital of ten million dollars. The output results represent daily performance and trading details.
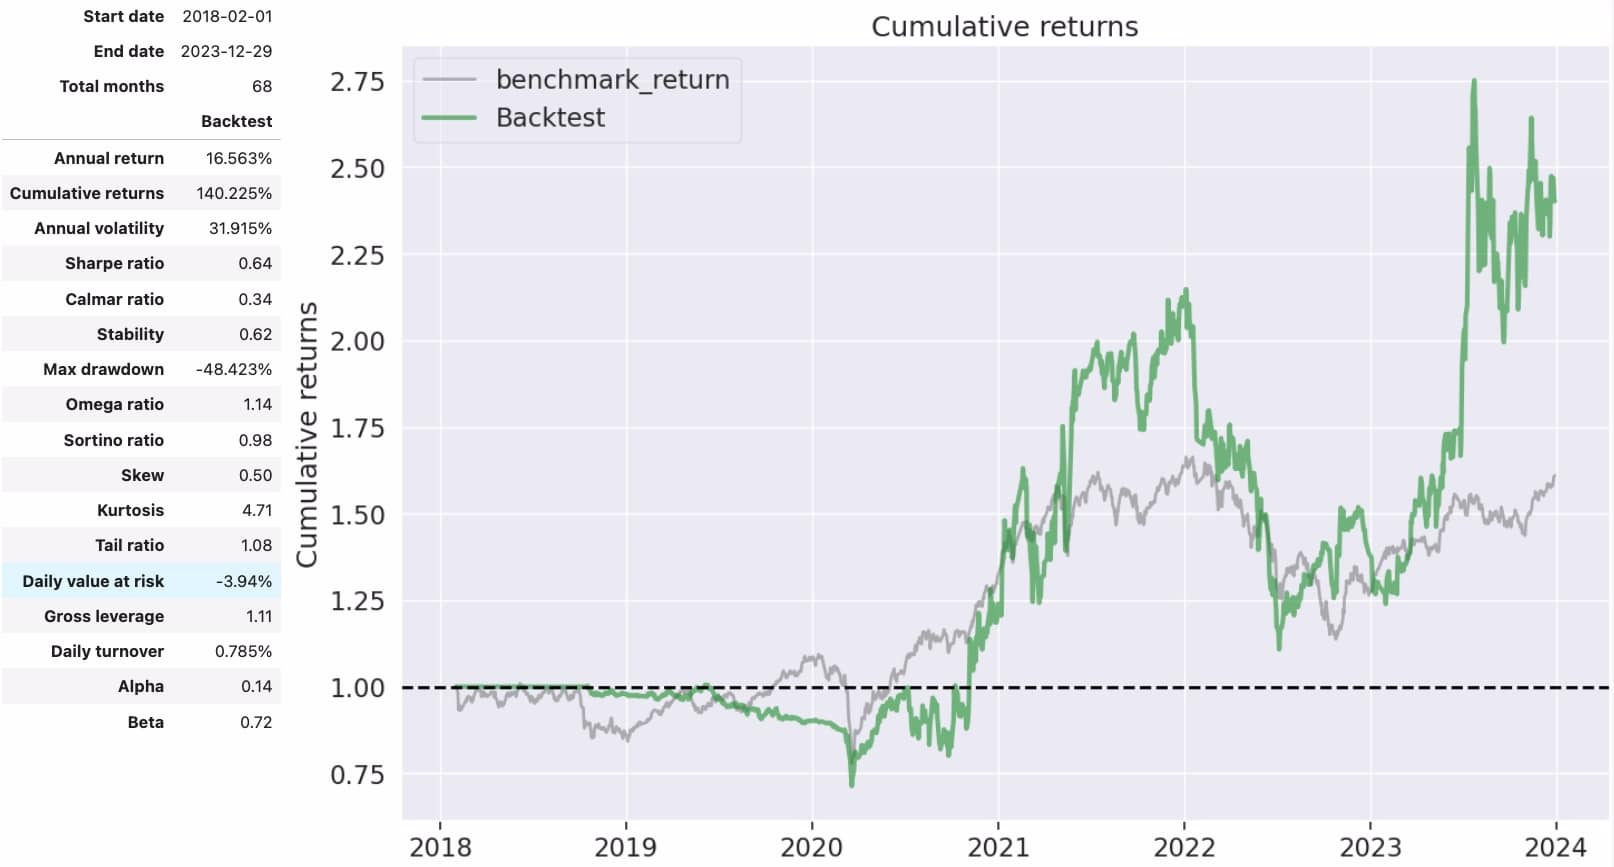
We can see that the momentum factor strategy achieved an annualized return of approximately 16.56% over these 68 months, with a cumulative return of 140.25%. The profit performance is quite impressive. However, relative to the strategy’s characteristics, there may be a lag in entry. For example, we cannot immediately follow up on stocks with good performance this month; instead, we must wait for some time to buy in. Therefore, missing the entry point may be the reason for the performance discrepancy between Q1 and Q2 of 20 years compared to the benchmark. However, this lagging effect may also bring more excess returns to the strategy. For example, when the market sentiment in a particular sector improves, the strategy has already bought in due to its previous good momentum, equivalent to early positioning. Therefore, it is speculated that such significant outperformance occurred in the second half of 21 and 23 years. However, regarding the lagging issue, we can complement it with indicators such as RSI (TQuant Lab RSI moving average strategy) or volatility-related indicators, which can be further explored.
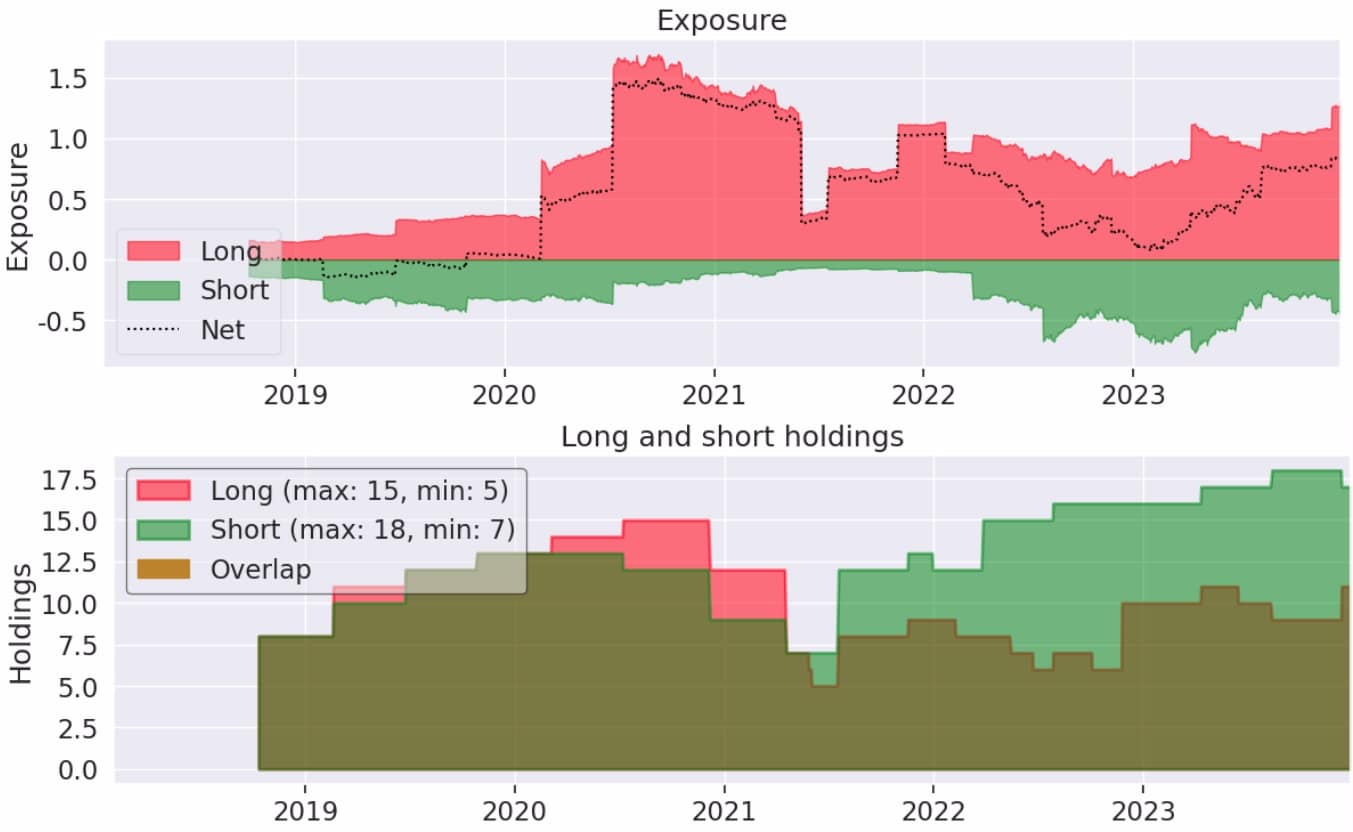
The total amount of long positions is more significant than that of short positions, but there are more trading stocks in short positions.
This strategy applies the conclusion of The Relationship between Price Momentum and Expected Stock Returns. and simulates backtesting based on the concept of momentum factor: “Stocks with good past performance are likely to perform well in the future, and vice versa,” verifying the profitability of “the strong get stronger, and the weak get weaker” in the Taiwan stock market. Investors are welcome to refer to it. In the future, we will continue introducing various indicators using the TEJ database and backtesting their performance. Therefore, readers interested in various trading backtesting scenarios are welcome to purchase relevant solutions from TEJ Market Data to construct their trading strategies using high-quality databases.
This is a gentle reminder that this strategy is for reference only and does not represent advice on commodities or investments.
“Taiwan stock market data, TEJ collect it all.”
The characteristics of the Taiwan stock market differ from those of other European and American markets. Especially in the first quarter of 2024, with the Taiwan Stock Exchange reaching a new high of 20,000 points due to the rise in TSMC’s stock price, global institutional investors are paying more attention to the performance of the Taiwan stock market.
Taiwan Economical Journal (TEJ), a financial database established in Taiwan for over 30 years, serves local financial institutions and academic institutions, and has long-term cooperation with internationally renowned data providers, providing high-quality financial data for five financial markets in Asia.
With TEJ’s assistance, you can access relevant information about major stock markets in Asia, such as securities market, financials data, enterprise operations, board of directors, sustainability data, etc., providing investors with timely and high-quality content. Additionally, TEJ offers advisory services to help solve problems in theoretical practice and financial management!
