Stock screening from Buffett’s investing principles.

Table of Contents
Warren E. Buffett is the person who has made the most money from stocks in the history of the world. He returned to Omaha in 1956 and started with $100. As of August 1999, his total personal assets have reached $36 B, becoming the second richest person in U.S. in that time. Buffet’s investment principles are very simple. First, ignore the daily rise and fall of stock prices. Second, do not worry about changes in the overall economics situation. Third, invest with the mentality of buying a company instead of investing in stocks.
We use Windows OS and Jupyter Notebook in this article.
import tejapi
import pandas as pd
import numpy as np
tejapi.ApiConfig.api_key = 'Your Key'
tejapi.ApiConfig.ignoretz = True
Note: Remember to replace ‘Your key’ with the one you applied for. The last line indicates that we ignore the time zone.
loc , groupby , pivot_tableDue to part of principles cannot be quantified. Therefore, we choose only quantifiable principles. The basis of principles is to evaluate earning ability of company.
set_1set_2set_3set_4set_5set_6We choose the stocks which are eligible, and buy on 2020/1/1, hold until 2020/12/31. Each condition will make a set to save eligible stocks. Finally, make the intersection to get portfolio.
When we comparing whether each dollar of retained earnings creates a dollar of market value, it involves whether the company has been listed for long enough. Therefore we selected the companies which are alive in 2020 and listed for more than 7 years. Due to the formula of ROE, we can improved by borrowing, so we exclude the industries with high debt ratio such as banking and finance holding.
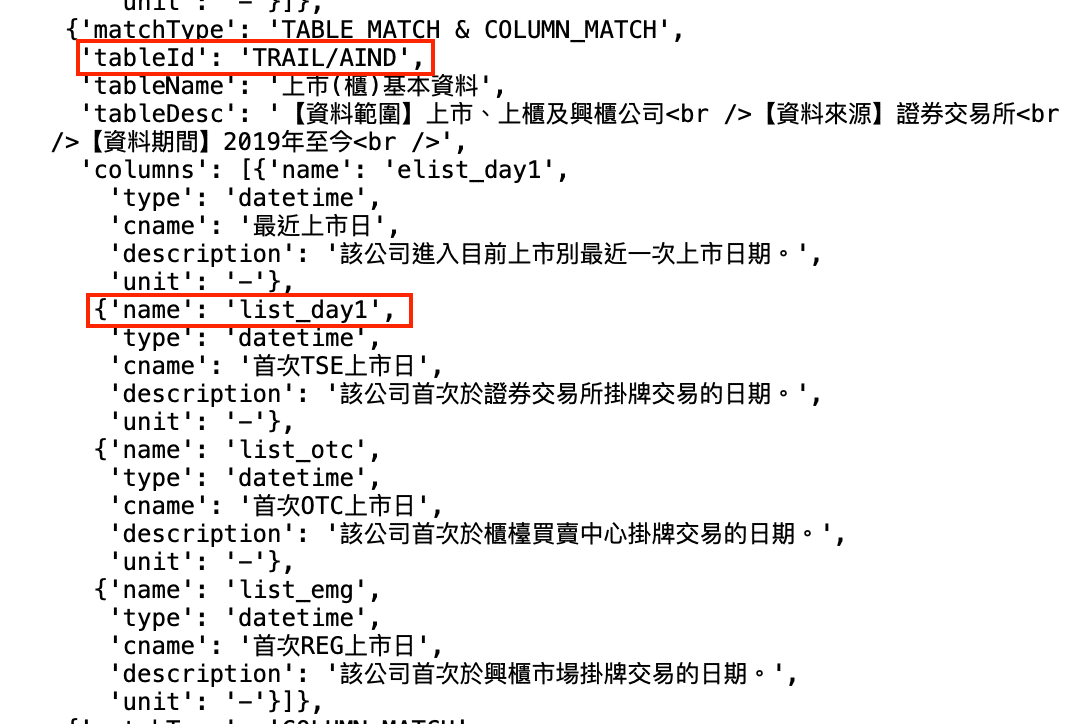
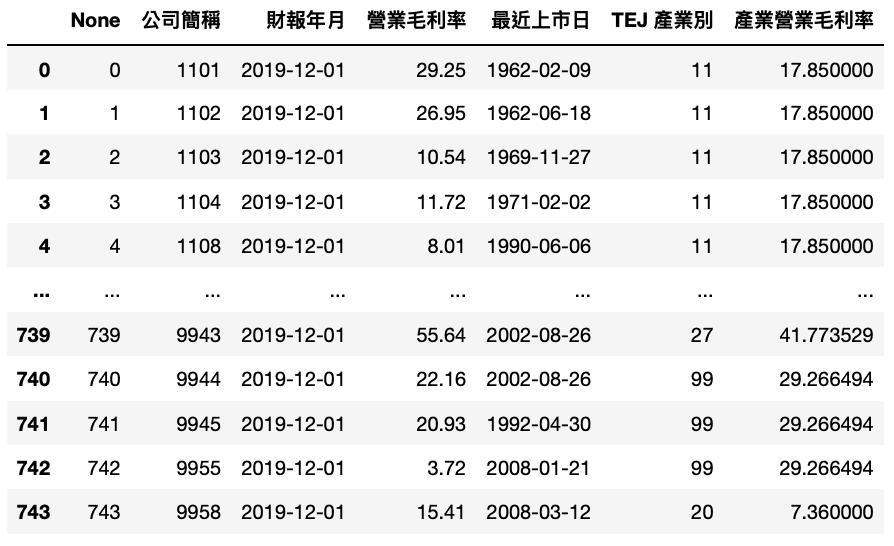
tejapi.search_table("上市日")
comp_data = tejapi.get('TWN/AIND',
                   elist_day1 ={'lt':'2013-01-01'},
                   ind = {'ne':('28', '30')},
                   mkt = 'TSE',
                   opts = {'columns':['coid', 'elist_day1',
                           'ind']},
                   chinese_column_name=True,
                   paginate=True
                  )
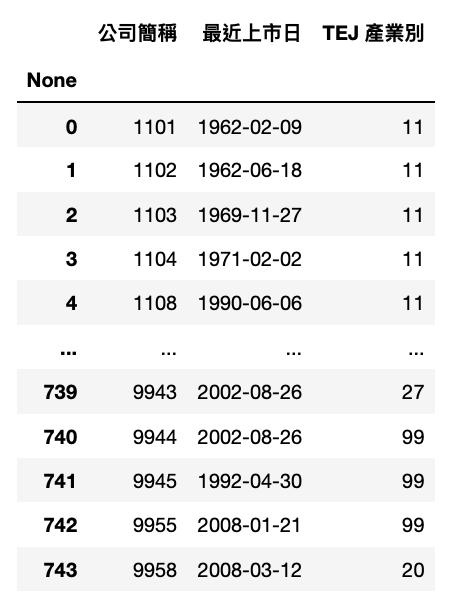
Obtain a list eligible companies and use it to create industry average data later.
comp_list = list(comp_data['公司簡稱'])
industry_list = comp_data["TEJ 產業別"].unique().tolist()
Create ROE dict of all companies in industry.
industry_data = tejapi.get('TWN/AIND',
                    ind = industry_list,
                    mkt = 'TSE',
                    opts = {'columns':['coid', 'ind']},
                    chinese_column_name=True,
                    paginate=True
                   ).reset_index(drop=True)
The dict of key is industry and value is list of companies.
industry_dict = {}
for i in industry_list:
    industry_dict[i] = industry_data[industry_data['TEJ 產業別'] ==
    i]['公司簡稱'].tolist()
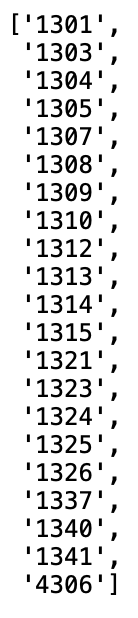
For example, search the companies in industry 13.
industry_dict["13"]
The following stock selection methods are similar to this. This content will be more complicated. Readers can check the complete code if you do not understand.
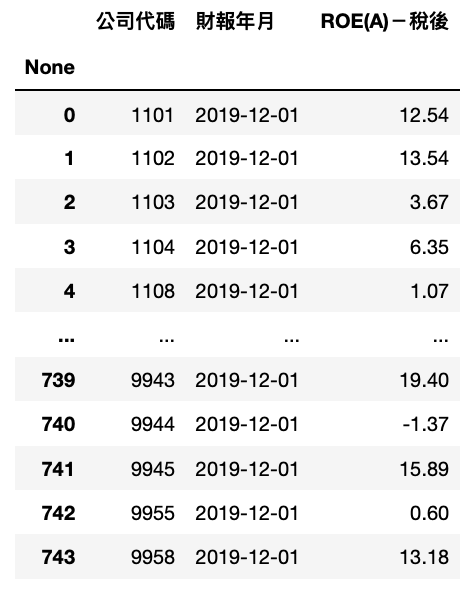
ROE_data = tejapi.get('TWN/AIM1A',
                  coid = comp_list,
                  mdate= '2019-12-01',
                  opts={'pivot':True,
                        'columns':['coid', 'mdate', 'R103']},
                  chinese_column_name=True,
                  paginate=True)
industry_roe = {}
for i in industry_list:
data = tejapi.get('TWN/AIM1A',
coid = industry_dict[i],
mdate='2019-12-01',
opts={'pivot':True,
'columns':['coid', 'mdate', 'R103']},
chinese_column_name=True,
paginate=True).reset_index(drop=True)
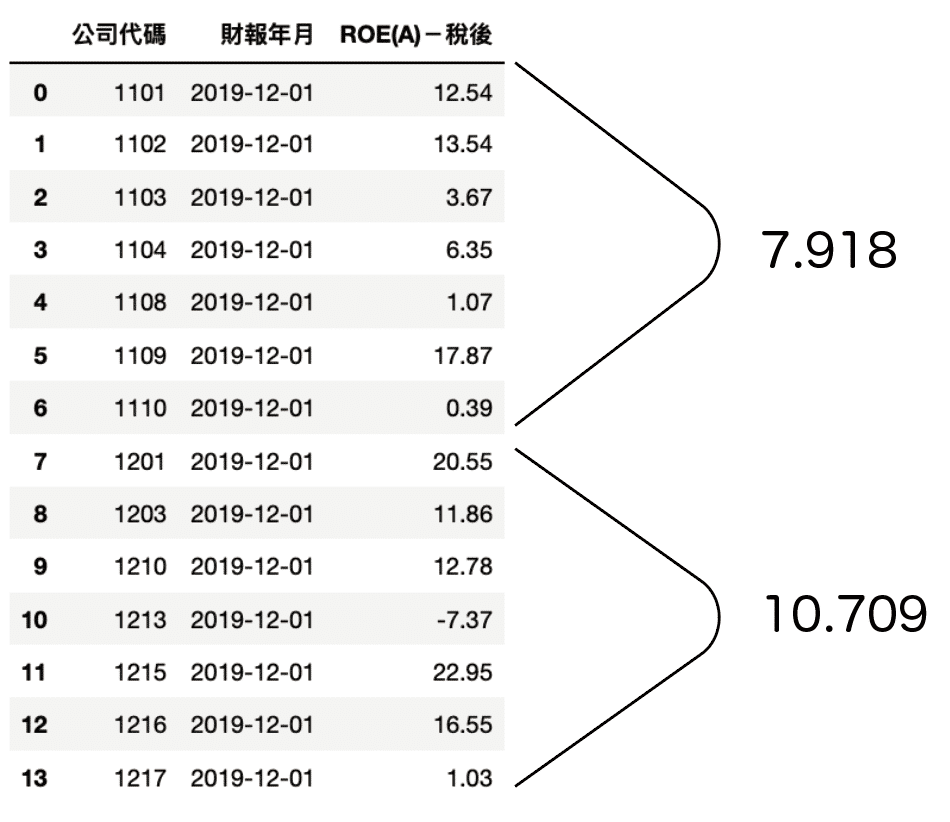
industry_roe[i] = data.groupby('公司代碼').mean().mean()[0]
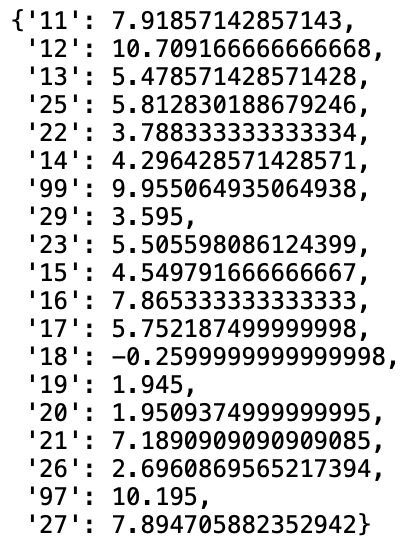
ROE_data['產業淨值報酬%'] = ROE_data['TEJ 產業別'].apply(lambda x: industry_roe[x])
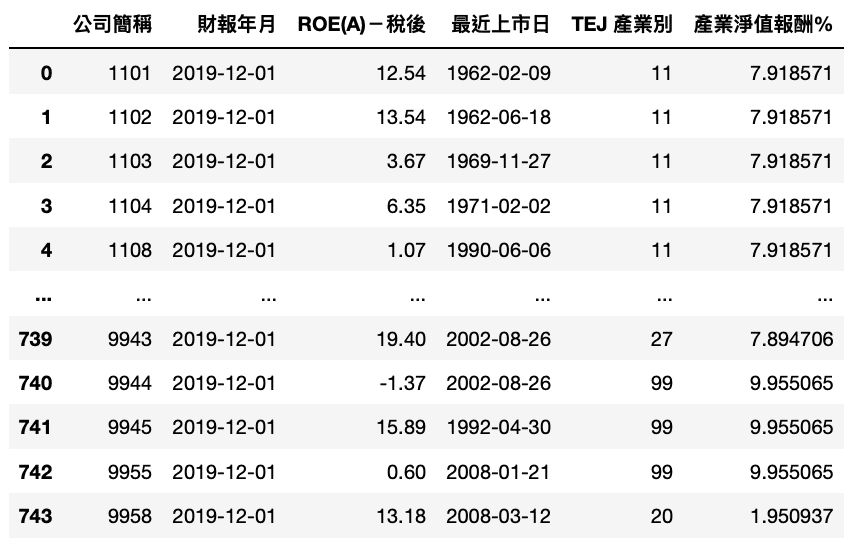
set_1 .set_1 = set(ROE_data[ROE_data['ROE(A)-稅後'] > ROE_data['產業淨值報酬%']]['公司簡稱'])
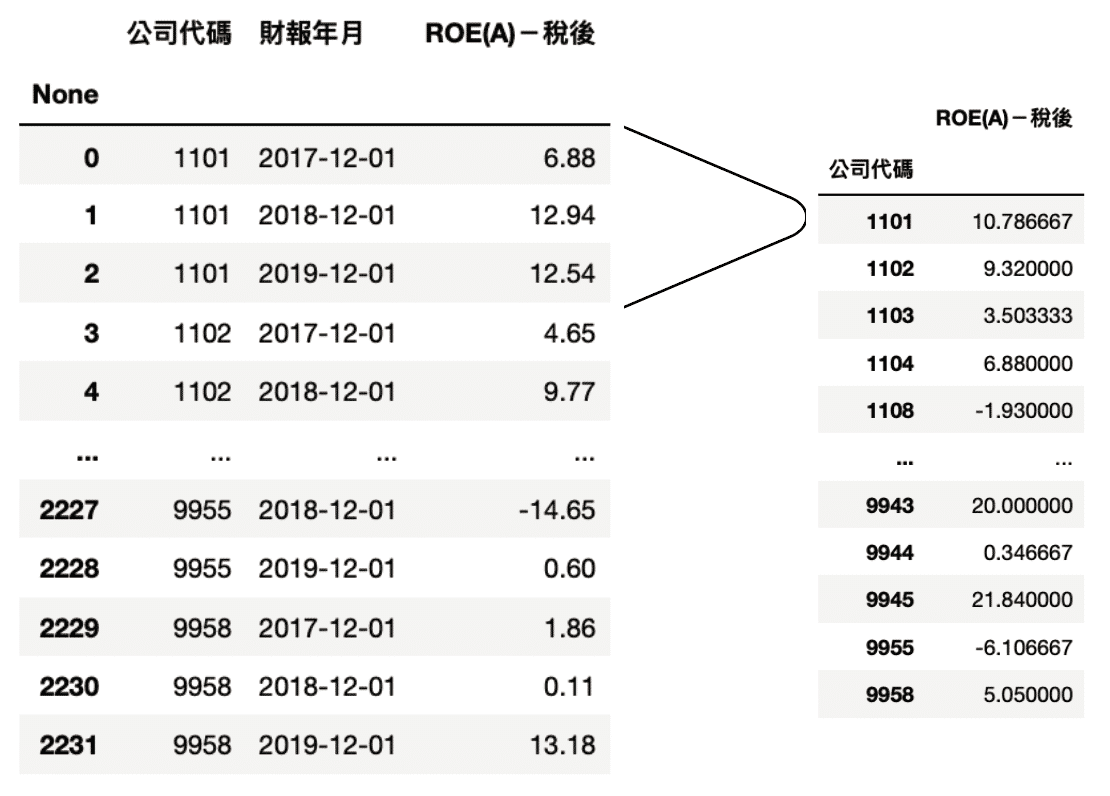
Choose 3-year data and operate like point 1method groupby. Then get averaged numbermean and save toset_2 .
ROE_data_3Y = tejapi.get('TWN/AIM1A',
                      coid=comp_list,
                      mdate=['2017-12-01','2018-12-01','2019-12-
                              01'],
                      opts={'pivot':True,
                            'columns':['coid', 'mdate', 'R103']},
                      paginate=True,
                      chinese_column_name=True,
                     )
The operation method is similar to point 1. We save eligible companies into set_3 .
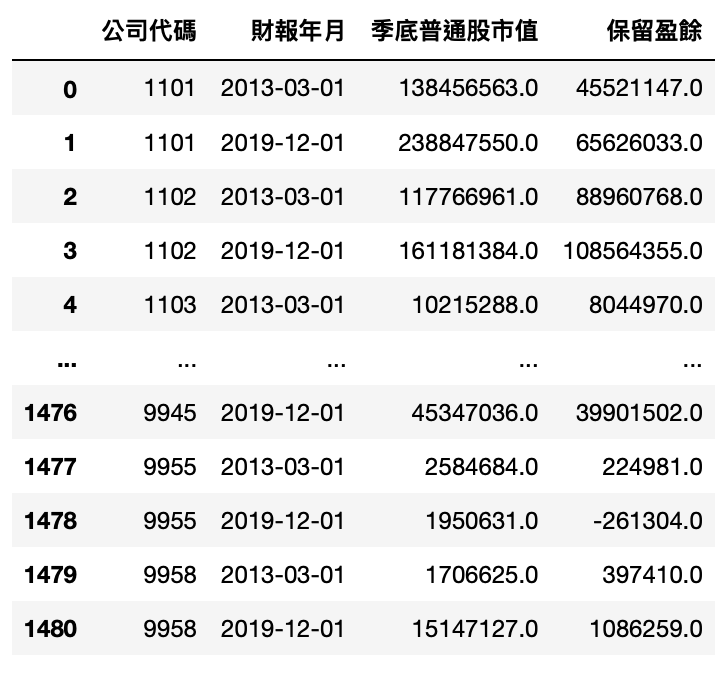
MV_RE_data = tejapi.get('TWN/AIM1A',
                coid = comp_list,
                mdate= ['2019/12/01','2013/03/01'],
                opts={'pivot':True,
                        'columns':['coid', 'mdate','MV','2341']},
                chinese_column_name=True,
                paginate=True
               ).reset_index(drop=True)
pivot_tableMV_RE_data.pivot_table(index='公司代碼', columns='財報年月').reset_index()
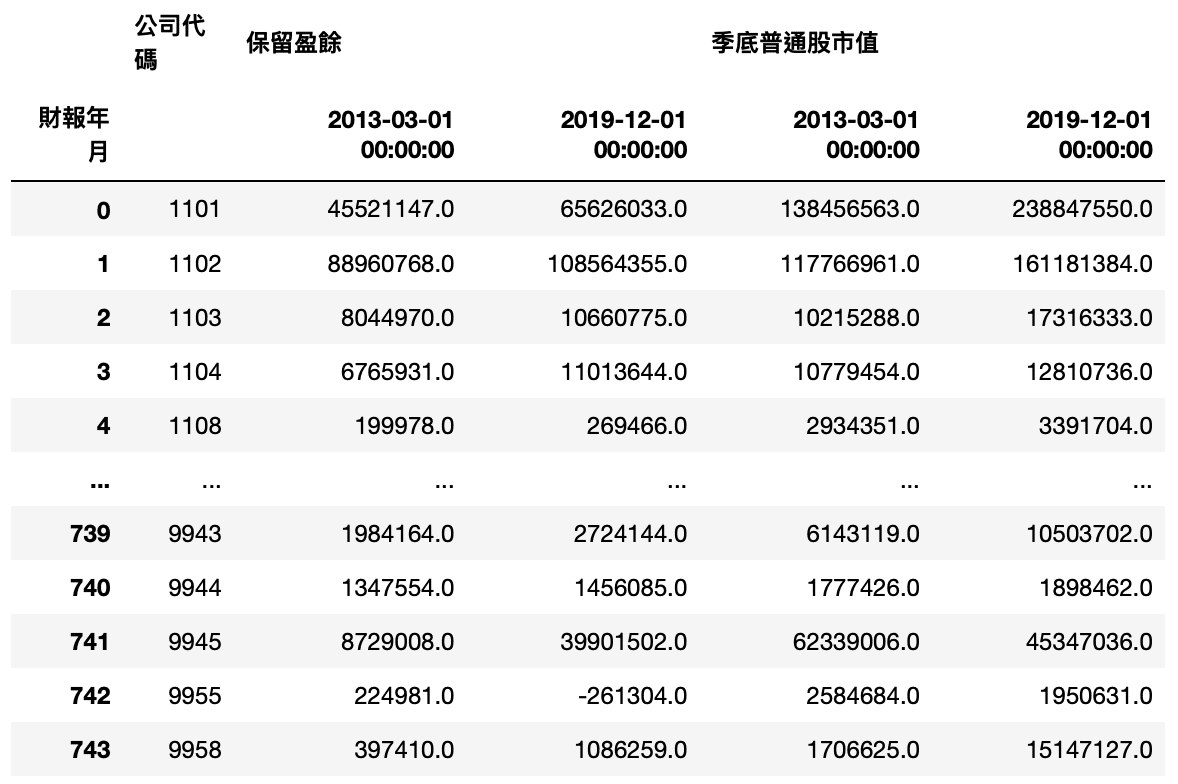
MV_RE_data['保留盈餘增加值'] = MV_RE_data.iloc[:,2] - MV_RE_data.iloc[:,1]MV_RE_data['市值增加值'] = MV_RE_data.iloc[:,4] - MV_RE_data.iloc[:,3]
MV_RE_data['指標'] = MV_RE_data['市值增加值'] / MV_RE_data['保留盈餘增加值']
set_4 .set_4 = set(MV_RE_data[MV_RE_data['指標']>1]['公司代碼'])
cash_data = tejapi.get('TWN/AIM1A',
                  coid= comp_list,
                  mdate=['2013-12-01', '2019-12-01'],
                  opts={'pivot':True,
                        'columns':['coid', 'mdate', 'R69B']},
                  paginate=True,
                  chinese_column_name=True,
                 )
pivot_table and Subtract the two columns.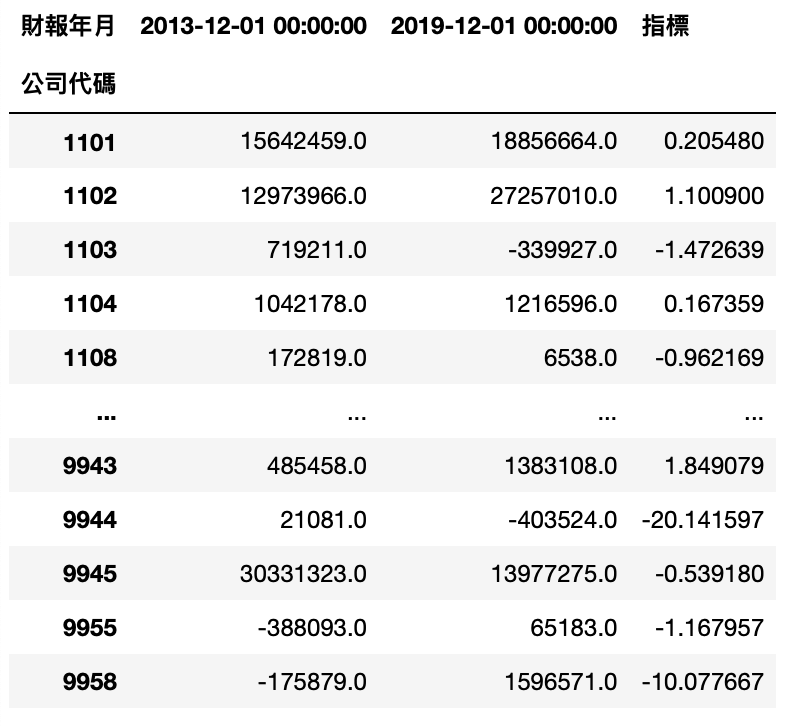
set_5set_5 = set(cash_data[cash_data['指標'] > 1].index)
numpy_financial . Its documentation is here. Type pip install numpy_financial in terminal.import numpy_financial as npf
For instance, a company 4-year FCF are 100 / -150 / -200 / 400. We can use NPV method to calculate its present value by setting discount rate 10%.
cash_flows = np.array([100, -150, -200, 400])
npf.npv(0.1, cash_flows)
def Cashflows(y0):
    y1 = y0 * 1.15
    y2 = y1 * 1.15
    y3 = y2 * 1.15
    y4 = y3 * 1.05
    y5 = y4 * 1.05
    y6 = y5 * 1.05
    y7 = y6 * 1.05
    y8 = y7 * 1.05
    y9 = y8 * 1.05
    y10 = y9 * 1.05

    cashflows = np.array([y1,y2,y3,y4,y5,y6,y7,y8,y9,y10])

    return cashflows
MV_cash_data = tejapi.get('TWN/AIM1A',
                  coid= comp_list,
                  mdate='2019-12-01',
                  opts={'pivot':True,
                        'columns':['coid', 'mdate', 'R69B',
                                   'MV']},
                  paginate=True,
                  chinese_column_name=True,
                 ).reset_index(drop=True)
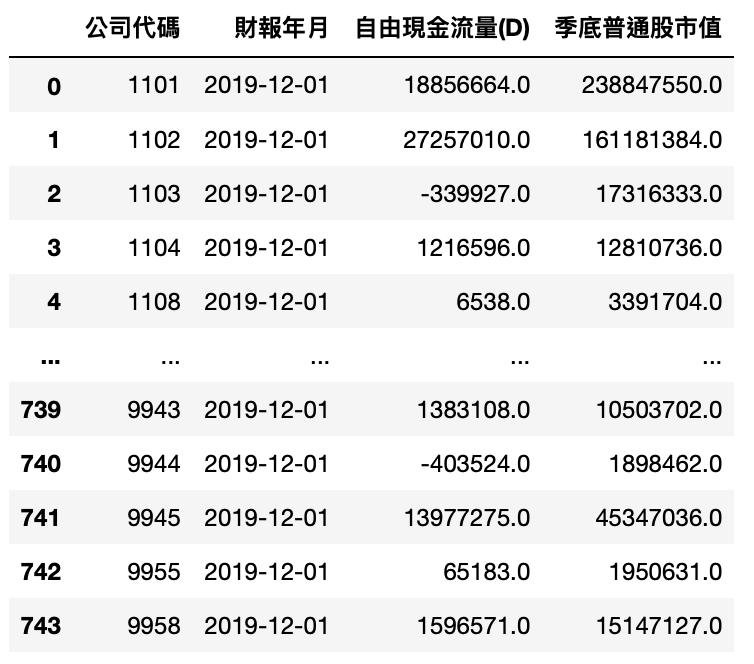
MV_cash_data['自由現金流量(D)'].apply(lambda x: npf.npv(0.09, Cashflows(x)))
MV_cash_data['指標'] = MV_cash_data['季底普通股市值'] / MV_cash_data['自由現金流量(D)'].apply(lambda x: npf.npv(0.09, Cashflows(x)))
Step 3. Save to set_6
set_6 = set(MV_cash_data[(MV_cash_data['指標']<1) & (MV_cash_data['指標']>0)]['公司代碼'])
Coming to the final stage we are most looking forward to, take the intersection of each set to get our portfolio.
set_1 & set_2 & set_3 & set_4 & set_5 & set_6

Refer to 【Application(5)】Modular Backtesting System. We put this list into the system. Because the price gap of the stock is too large, we use equal weight to buy and hold. Obtain the return rate is
More proficient in operating database, more able to design personalized stock selection. You can also test various stock selection stratigies. The content of this article is more complicated and requires more effort to study. If you have interest on this topic, you can go to our official website. It provides various financial data to help you make better strategy.
The content of this webpage is not an investment device and does not constitute any offer or solicitation to offer or recommendation of any investment product. It is for learning purposes only and does not take into account your individual needs, investment objectives and specific financial circumstances. Investment involves risk. Past performance is not indicative of future performance. Readers are requested to use their personal independent thinking skills to make investment decisions on their own. If losses are incurred due to relevant suggestions, it will not be involved with author.
