Table of Contents
In 2014, the CFA Institute in the US began discussing the incorporation of ESG (Environmental, Social, and Governance) factors into investment decision-making and business valuation. However, the measurement involved in each rating varies greatly, thus confusing users. Given this, TEJ released the “TESG Rating Index (TESG Rating) ” on March 31, 2022, a tool for reference in investment and credit. What’s more, we use the TESG Rating to explore its correlation with commonly-used valuation multiples, such as the price-to-book (P/B) ratio and price-to-earnings (P/E) ratio.
This article describes the correlation between ESG and corporate value, introduces how ESG factors are currently incorporated into valuation practices. We also explain the empirical analysis model and its results. Finally, we suggest directions for upcoming research.
Good ESG practices have become increasingly crucial for companies looking to improve their financial performance, corporate reputation, and long-term sustainability. Below are five advantages of good ESG practices:
1. Reduction in operating costs
2. Policy support and subsidies
3. Revenue growth
4. Employees’ quality
5. Sustainable competitiveness
Nevertheless, previous literature suggests that excessive emphasis on ESG may lead to decisions that harm corporate value. Taking one aspect of S (social responsibility) in ESG, “Diversity,” as an example, if diversity is defined as “the company needing to recruit employees with specific personal characteristics to meet a certain percentage,” management may give up promoting the best employees simply to achieve that percentage, thus harming corporate value.
To summarize, pieces of literature generally support the positive impact of ESG on corporate value. And as ESG ratings become more popular, companies with good ESG ratings have lower risks and may obtain more favorable financing rates, reducing the overall cost of capital.
However, the traditional valuation method doesn’t consider the risks caused by ESG practices.
(1) Market approach
The market approach adjusts companies’ valuation based on their ESG practices using publicly available information or ESG ratings from institutions. However, this method is subjective in determining the extent of adjustment. It may result in double-counting errors if the industry, such as the automotive, food, or chemical industry, already reflects the differences in ESG.
(2) Income Approach – Cost of Capital
The income approach can adjust the cost of equity and discount rate to reflect ESG risks, increasing the cost of equity and the WACC. However, this approach still suffers from subjective and difficult-to-explain shortcomings; adjusting the discount rate may also lead to double counting if beta values have reflected the market’s perspectives on ESG risks.
(3) Income Approach — Cash Flows
The above two methods have significant drawbacks, so the industry and academia currently recommend using the income approach’s cash flows to reflect the impact of ESG. Compared to adjusting the market multiplier and discount rate, losses such as reduced revenue, increased costs, and fines due to the negative effect of ESG on the company are more easily estimated. Regulators and appraisers can consider the differences between the company and its industry, evaluate the significance of each ESG aspect, and supplement it with scenario analysis to partially reduce concerns about subjective factors.
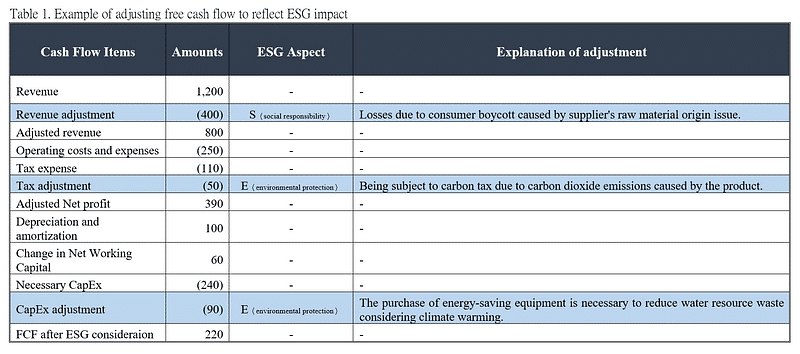
As shown in Table 1, the management listed three significant ESG aspects that may affect the company’s cash flow: one S and two E. After considering the impact of ESG, the free cash flow is 220. Only the possibility of “purchasing energy-saving equipment considering climate warming “ is believed to be relatively high. If so, the free cash flow after considering ESG will increase to 590. After a professional judgment of its probability, the probability of the situation where the free cash flow considering ESG is 220 is 20%, and the probability of the situation where it is 590 is 80%— the free cash flow’s weighted average is 516— as shown in Figure 2.
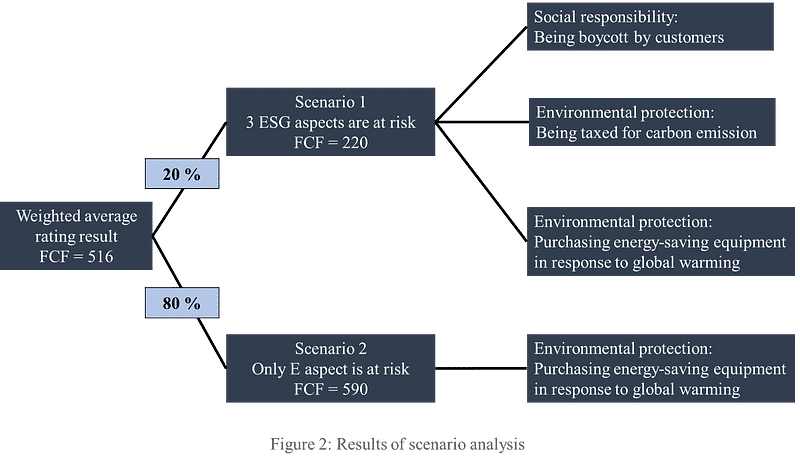
We can see from the above by adjusting the cash flow to the magnitude of each ESG aspect, the subjectivity is relatively low, and the reasonability of the predictability is increased.
? Empirical analysis of the model
(1) Analysis of annual and Company Coverage
This study uses the TESG Rating for empirical analysis consistent with the database. However, given the importance of the information disclosure variable added to the TESG Rating since 2019, the analysis period of this study is from 2019 to 2020. In addition, companies listed on the stock market are included, while emerging market companies are excluded. The market multiplier data source is the TEJ stock price database.
(2) Research Methodology
According to the SASB standards, each industry has unique ESG disclosure items. so ESG ratings between different industries shouldn’t be compared.
For convenience, this study takes June 30 as the base date, collects the closing price of trading days after June 30, including the next day, week, month, and six months, and calculates the average P/B and P/E of companies at different TESG levels complying with the different SASB primary industry categories. In addition to TESG levels, this study explores whether the relative implications of the levels and the raw quantitative scores impact the results. This study expects that good ESG will positively impact company value, so the market should give higher multipliers.
(3) Descriptive Statistical Results
The results show that regardless of the stock prices used after the base date and whether based on the relative implications or levels of TESG, in the four SASB primary industries of financial, food and beverage, consumer goods, and transportation, a positive correlation between ESG quality and the average P/B multiplier can be observed (please refer to Table 3 and Table 4). However, there are no significant differences in other SASB primary industry categories. The effect of the average P/E multiplier is weaker. Only a positive correlation between ESG quality and the average P/E multiplier can be observed in the financial and transportation industry categories.
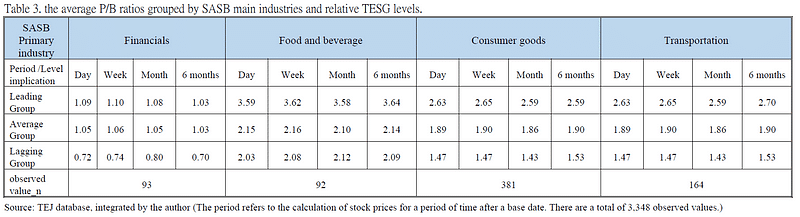
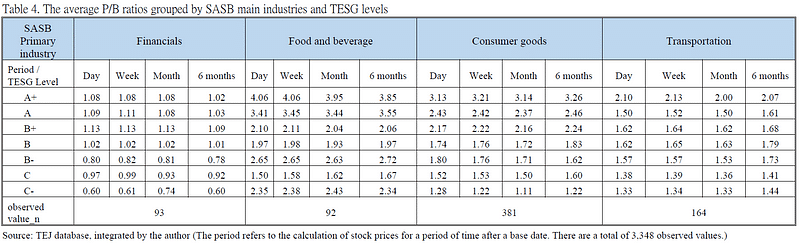
Table 4 shows that although the average P/B ratios don’t strictly decrease as ESG grades shift from A+ to C-, the groups with higher TESG levels generally have higher average P/B ratios. This trend becomes even more apparent when grouping is based on implications of the levels, as shown in Table 3. It is worth noting that the choice of stock price calculation doesn’t significantly impact the results, but further research may explore this in more depth.
(4) Regression Analysis
We also conducted regression analyses to directly investigate the relationship between TESG ratings and multipliers. First, four types of P/B multipliers over different periods were used as the dependent variable Y, while the quantified levels (or Level implication, Raw scores) and changes in quantified levels in the current period were used as independent variable X. Regression analyses were separately conducted for four SASB industries: financial industry, food and beverage, consumer goods, and transportation. The results are shown in Table 5 and explained below:
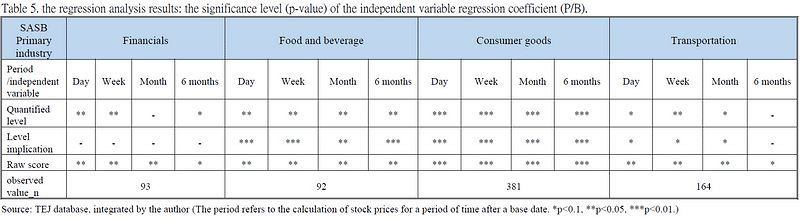
Take the transportation industry as an example, a regression analysis was conducted with the P/B ratio one month after the base date as the dependent variable Y and the quantified level and changes in the current period’s quantified level as independent variable X. The regression coefficient p-value for the quantified level was found to be < 0.1. When raw scores replaced the quantified level, the regression coefficient p-value for the raw scores was < 0.05.
In Table 5, all significant independent variables had positive regression coefficients, indicating a significant positive correlation between the independent variables and the P/B ratio. This suggests that as the TESG rating improves, the P/B ratio for companies in SASB primary industries also increases, indicating a better valuation by market. This is consistent with the expectations of this study. Among these, the effects were most significant in the consumer goods and food and beverage industries, while those were not significant in certain conditions in the financial and transportation industries.
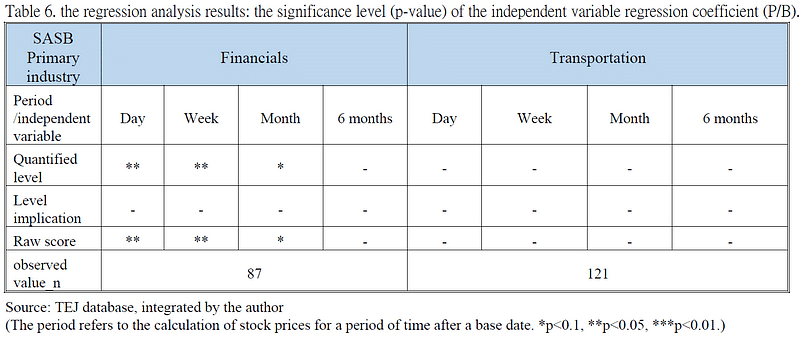
As shown In Table 6, all significant independent variables have positive regression coefficients, suggesting a significant positive correlation between the independent variables and the P/E ratio. The results show that when using stock prices one day, one week, or one month after the base date, the higher the TESG rating of financial companies, the higher the P/E ratio. However, the effect is insignificant in the transportation industry.
While incorporating ESG factors in evaluating companies is widely accepted in the valuation field in Taiwan, actual cases of its application still need to be made available and comprehensive. If adjustments are necessary, adjusting cash flows in the income approach is recommended due to its analytical basis and objectivity.
In addition, this study utilized TEJ’s recently proposed TESG Rating Index for empirical research and found a significant positive correlation between the P/B ratio and ESG ratings for companies in the food and beverage, consumer goods, and transportation industries under SASB.
For companies in the financial industry, the P/B and P/E ratios were significantly positively correlated with their ESG ratings. It is assumed that the financial and food industries are subject to regulatory oversight; they have had to prepare CSR reports since 2014. As a result, market investors pay relatively more attention to CSR issues and consider them in their investment decisions, influencing stock prices.
This study provides an initial exploration of the relationship between ESG and valuation multipliers, but there is still room for improvement and further discussion. For example, consider adding additional control variables (profitability, revenue growth rate, etc.) to the regression model and obtaining data for longer years. This study found that the association between the P/B, P/E ratios, and TESG Rating was limited to specific industries, with P/B ratios being more significant. Reasons are required for further clarification. Additionally, the results for other valuation multipliers (EV/REV, EV/EBIT, EV/EBITA, etc.) remain to be revealed in future research.
