On December 12, 2015, 195 countries worldwide jointly adopted the Paris Agreement, the main objective of which is to make the average temperature of this century compared to the average temperature before the industrial revolution increase by no more than 2 ℃(3.6 °F). Although Taiwan is not one of the signatories, it is still contributing to this issue and moving towards the 2050 carbon neutrality target. In the past six years since the agreement, has Taiwan made progress in reducing carbon emissions? Or still stagnant? Therefore, this article uses a quantitative indicator, the carbon emission index, to examine whether the carbon emission reduction strategy is effective. The carbon emission index takes 2015 as the base period (the base period index is equal to 100), analyzing the carbon emission trends of the market and various industries since 2016. The higher the carbon emission index value, the less effective the carbon reduction strategy is.
Table of Contents
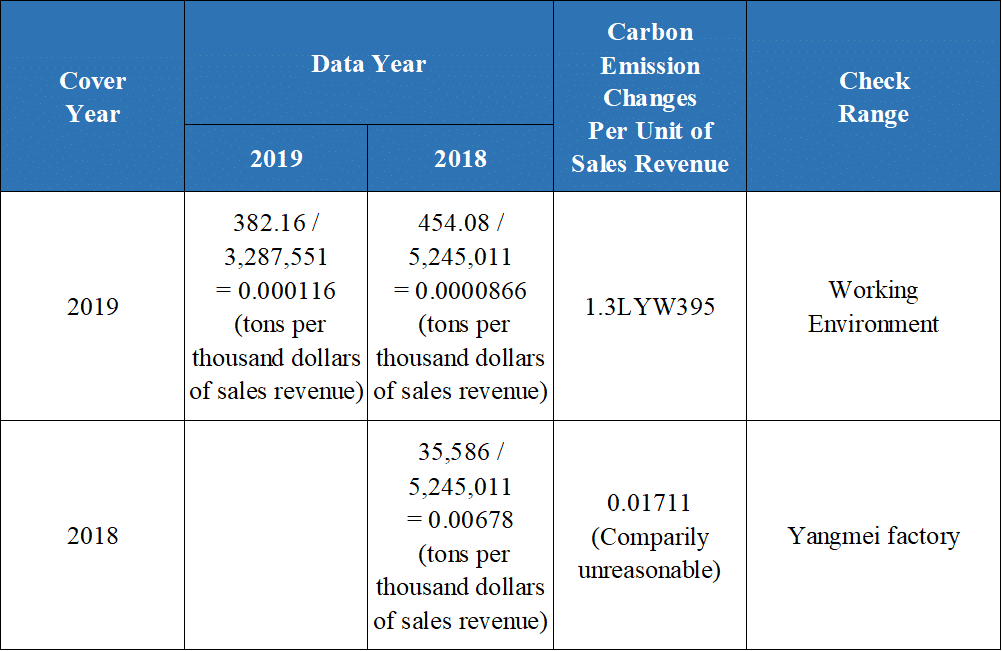
In this article, we prioritize the data provided in the same Sustainability Report to calculate the change in carbon emissions per revenue unit to minimize errors.
Table 1: Carbon Emission Change of Different Cover Annual Sustainability Reports (Source: Market Observation Post System)
The highlights of the index compilation are as follows:
※Revenue and carbon emissions may have exceptional circumstances due to industry characteristics. For example, if the construction industry is using the complete contract method or the pharmaceutical industry is in the development stage, there may be carbon emissions but no revenue for the year. So, in addition to the carbon emissions per unit of revenue, we can also look at the industry’s total carbon emissions.
Similar to the above index algorithm, it will not be counted if a stock has Zero revenue/ Zero carbon emissions/ No carbon emission information announced for the year.
Table 2: Each Industry Unit Carbon Emission Indicator from 2016 to 2020
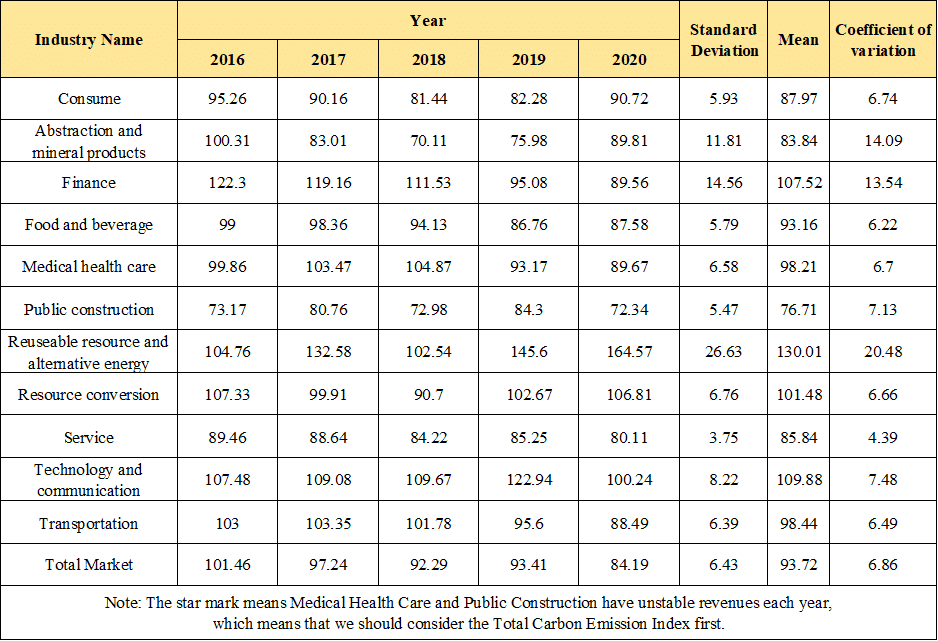
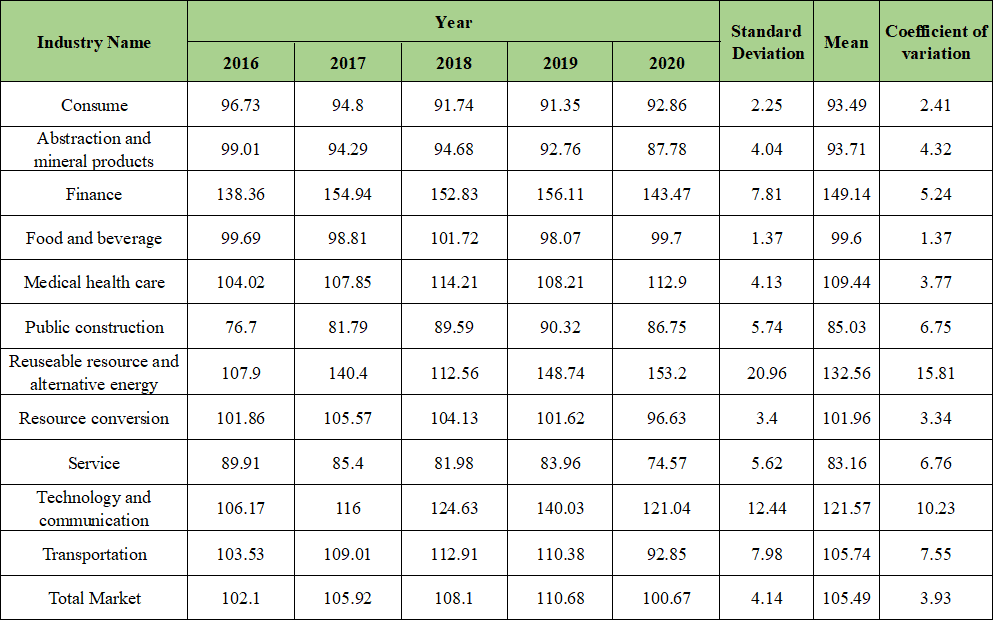
Table 3: Industry Total Carbon Emission Index from 2016 to 2020
“The following is an analysis of the index results for several industries and individual companies.”
Carbon emissions in the financial sector increased compared to the base period, but the increase in revenue was more significant. After the unitization of carbon emissions, the value of the Industry Unit Carbon Emission Indicator is better than the base period. This result represents the financial sector considering revenue growth and carbon emissions management.
Except for 2016, Per Unit Carbon Emission Index was soaring high due to the expansion of the carbon emissions calculation scope of Cathay Gold (2882), CITIC Gold (2891), and Fubon Gold (2881). Under the strict supervision of the Financial Supervisory Commission in recent years, the implementation of environmental protection by the financial industry has been in progress. The following years have seen a year-on-year decline and a significant improvement.
The 2020 Industry Unit Carbon Emission Indicator for the renewable and alternative energy industry is worse than the base period and is as high as 164.57. Except for the reason that there are too few adequate component stocks, YFY, the company with the highest industry carbon emission, has different variation amounts in its numerator and denominator of the per unit carbon emission rate, which makes the industry index coordinate with it.
Delta can be considered a model for environmental protection. With the company’s goal of using 100% renewable energy by 2030, the construction of green buildings on campus, and its inclusion in the Dow Jones Sustainability Index (DJSI World) for eleven consecutive years, Delta has become the best representative of energy conservation and carbon reduction. The performance of Delta’s Individual stock carbon emission index is quite impressive, with the value reduced by more than half compared to the base period.
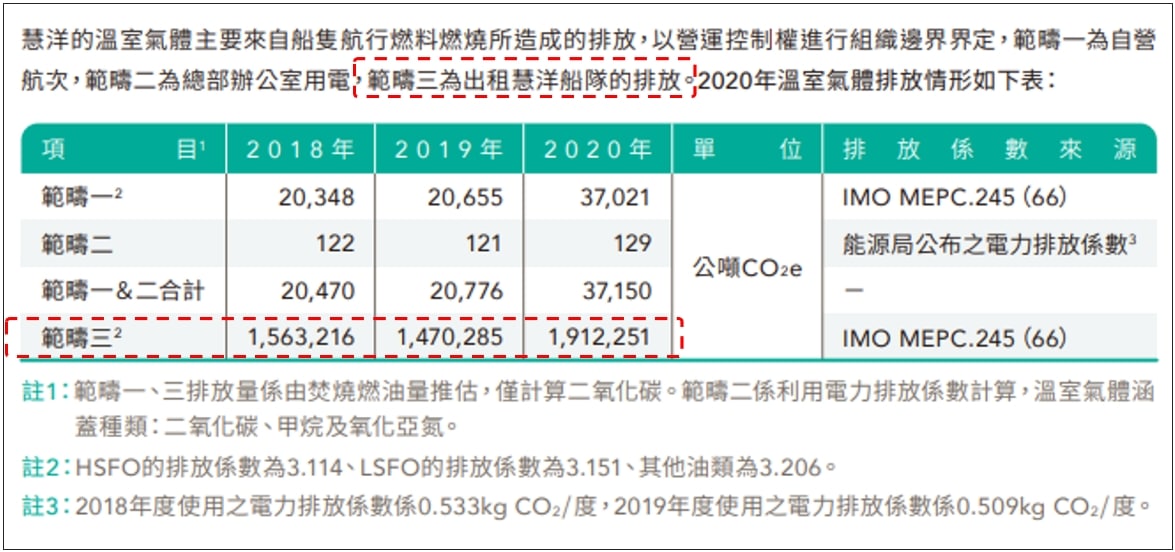
In 2018, Wise-KY’s carbon emissions per unit of revenue decreased from 0.1396 (tons/thousand dollars sales revenue) to 0.001566 (tons/thousand dollars sales revenue), resulting in a significant decrease in the Per Unit Carbon Emission Index 110.70 to 1.24 in that year. From the company’s 2018 Sustainability Report, we know that the substantial reduction in the Per Unit Carbon Emission Index for that year was due to the addition of Scope 3 to the Sustainability Report’s carbon emissions disclosures from 2018. Moreover, many carbon emissions data move from Scope 1 to Scope 3.
The statistical results show that the market’s total carbon emission index is greater than the base period. However, the per unit carbon emission indicator decreases from a base value of 100 in 2015 to a value of 84.19 in 2020, a decrease of about 3% per year, indicating that while pursuing revenue growth, TSE/OTC companies are effectively improving their carbon emissions.
Changes in the scope of the carbon emission index calculation will affect the interpretation of data. TEJ’s database discloses the full range of carbon emissions in scopes 1 to 3. The database distinguishes between the year of disclosure (the year of the Sustainability Reports) and the year of reporting and specifies the calculation scope. Users can understand whether each year is compared on the basis.
TEJ has already used the degree of progress in carbon emissions as the environmental component of the TESG Sustainability Index. In the future, we will use the carbon emissions index to analyze the effectiveness of the carbon reduction strategies of enterprises and industries.
