

Introduction
Under the theoretical framework of the Efficient Market Hypothesis (EMH), stock prices should fully reflect all available information. However, information asymmetry remains widespread in actual capital markets, and market participants differ in their perception and access to corporate value information. As critical information intermediaries in capital markets, sell-side analysts continuously provide financial forecasts, investment ratings, and target prices through industry research, corporate visits, and financial modeling, exerting a tangible influence on market pricing. Nonetheless, the perspective of an individual analyst may still be influenced by investment banking relationships, herding behavior, or model assumption biases, thereby constraining their predictive power and information quality.
Based on these considerations, this study takes the concept of the ‘Wisdom of Crowds’ as its starting point, compiling ‘broker consensus data’ to transform vast and fragmented broker research reports across the market into structured signals viable for quantitative analysis. Theoretically, when the majority of institutional investors simultaneously form consistent optimistic expectations for a specific stock, it may reflect the directional allocation of market capital and potential trends in future stock price performance, thereby possessing substantial research value as quantitative investment factors.
This study utilizes the Alphalens factor testing framework, widely adopted in quantitative finance, to conduct empirical analysis on the Taiwan stock market from January 2020 to December 2025. It systematically examines the Alpha predictive power of broker consensus data across multiple dimensions. The research covers four core indicator categories: Level, Revision, Dispersion, and Breadth, and further explores their practical application value in constructing investment strategies.
💡 Curious about institutional and smart money footprints? Explore TEJ Broker Branch Trading Data to unlock granular market order flows.
Data Sources and Data Preprocessing
Data Sources
The data for this study is sourced from publicly available broker research reports and historical market trading data, focusing on individual stock target prices and investment rating information. All figures are adjusted for cash/stock dividends and stock splits to ensure objectivity and consistency across observation periods.
- Data Source: Broker investment recommendations and individual stock target price consensus data (excluding pure financial forecasts)
- Benchmark Adjustment: Historical market quotes and target prices are fully adjusted for dividends and stock splits to unify the comparative basis across periods
- Standardization of Investment Recommendations: Harmonizing broker ratings into a standardized quantitative scale of 1 to 5:
- Buy (including Strong Buy, Outperform): 5 points
- Accumulate / Buy on Dips: 4 points
- Hold / Neutral: 3 points
- Underweight: 2 points
- Sell: 1 point
- Consensus Calculation Window: Updated monthly, including qualified broker reports published within a 12-month lookback window from each month-end
- Update Integration Principle: If a single broker issues multiple reports within the observation window, the latest updated value within the eligible window serves as the current consensus baseline
Data Preprocessing
To ensure statistical robustness and practical representativeness, this paper implements further data screening and preprocessing. First, the sample period is set from January 2020 to December 2025, spanning diverse market cycles including the COVID-19 pandemic, global interest rate hikes, inflation-driven drawdowns, and the AI-driven bull market, thereby providing a comprehensive view of factor performance across bull-bear regimes.
Second, considering that insufficient analyst coverage may distort consensus signals, this study requires stocks to have coverage from at least three brokers (broker_count ≥ 3) to enhance the representativeness and reliability of the consensus indicators. After screening, the final research universe encompasses approximately 657 Taiwan-listed stocks, ensuring substantial market coverage.
Table 1 outlines the data preprocessing criteria and parameter configurations applied in this study.
Table 1: Data Preprocessing Conditions and Parameter Settings
| Condition | Parameter | Description |
| Research Period | 2020-01-01 ~ 2025-12-31 | Spanning complete market cycles including COVID-19, inflationary bear market, and AI bull rally |
| Minimum Broker Coverage | broker_count ≥ 3 | Ensuring statistical reliability of consensus indicators |
| Screened Sample Universe | Covering approximately 657 Taiwan-listed stocks |
Methodology
This study begins by conducting quantitative testing on individual standalone factors. Guided by single-factor empirical findings, we subsequently construct composite factors to evaluate the interaction effects across distinct information dimensions. The methodology employs the Alphalens factor analysis framework widely used in quantitative investment, sorting stocks into portfolios by factor scores and observing subsequent holding-period return profiles to examine whether a stable monotonic relationship exists between factor rankings and forward returns.
Core parameter settings for this study are summarized below:
- Forecast Horizon: Monthly frequency testing, rebalancing portfolios on the first trading day of each month.
- Portfolio Grouping: Equal quintile grouping based on factor values.
- Evaluation Metrics: Information Coefficient (IC) and ICIR (Information Coefficient Information Ratio) serve as primary evaluation criteria to examine cross-sectional correlation and return stability relative to forward returns.
Single-Factor Construction
To mitigate cross-month scale disparities, all factors undergo monthly cross-sectional percentile ranking and are normalized to a [0, 1] interval prior to empirical evaluation, enhancing stability and comparability across periods.
This study establishes four fundamental single factors corresponding to the Level, Revision, Dispersion, and Breadth dimensions of broker consensus data. Their definitions and calculation methods are presented in Table 2.
Table 2: Single-Dimensional Factors Examined in this Study
| Factor | Underlying Formulation | Sorting Order |
| rating_rank Average Investment Recommendation Score | Cross-sectional average of broker recommendation scores | Higher score, higher rank |
| ir_rank Average Implied Return | (Target Price – Report Date Close) / Report Date Close | Higher return, higher rank |
| disp1 Target Price Dispersion | Target Price Standard Deviation / Mean Target Price (Target prices fully adjusted for dividends and splits) | Lower dispersion, higher rank |
| noa2 Net Optimistic Analyst Ratio | (Brokers with Rating ≥ 4 − Brokers with Rating ≤ 2) / Total Broker Count | Higher optimism, higher rank |
Level Dimension
Level factors capture sell-side analysts’ prevailing sentiment and valuation conviction on individual equities, reflecting institutional optimism regarding forward company prospects. This study primarily evaluates two benchmark single factors: Average Investment Recommendation Score (rating_rank) and Average Implied Return (ir_rank).
Average Investment Recommendation Score (rating_rank)
rating_rank converts qualitative broker ratings (Buy, Accumulate, Neutral, Underweight, Sell) into numerical scores, computes the market-wide consensus average score, and applies cross-sectional percentile ranking to temper macro sentiment shifts.
Empirical results show that rating_rank achieves a mean IC of 0.0191 and an ICIR of 0.2109, standing out as one of the best-performing single factors in this study. This demonstrates notable cross-sectional predictive power and superior stability relative to peer factors.
Analyzing the quintile portfolio return spread reveals that portfolio returns broadly expand alongside higher recommendation scores. Notably, Quintile 5 (top 20% highest consensus ratings) delivers superior forward 1-month risk-adjusted alpha, proving that sell-side ratings convey effective pricing information. Furthermore, the monotonic progression across quintiles indicates persistent market underreaction to analyst recommendation signals.
However, sell-side analysts exhibit a well-documented optimistic skew, causing clustering in top-tier ratings. Particularly during bull cycles, numerous equities simultaneously receive ‘Buy’ or ‘Outperform’ designations, diluting discrimination within high-score quantiles. Therefore, while rating_rank offers stable predictive power, practical implementation warrants integration with complementary factors or filters to overcome signal saturation from rating congestion.
Figure 1: Quintile Mean Monthly Returns for ‘Average Investment Recommendation Score’ (rating_rank)
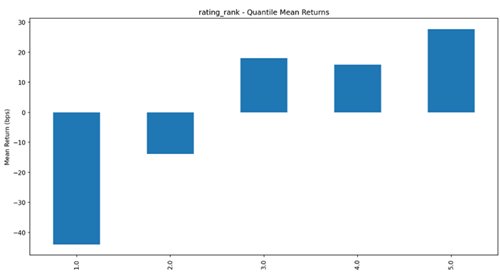
Note 1: Quintile 5 represents the top 20% highest average investment recommendation scores.
Note 2: Quantile returns are demeaned relative to the cross-sectional mean (Alphalens configuration: Demeaned=True).
Average Implied Return (ir_rank)
Implied return is defined as (Target Price – Report Date Close Price) / Report Date Close Price. Economically, it gauges analyst optimism regarding prospective upside potential at report publication. Cross-sectional percentile ranking yields the factor ir_rank, testing whether target price upside relative to current market price predicts future performance.
Empirical findings indicate that ir_rank registers a mean IC of 0.0154 and an ICIR of 0.1346, trailing behind rating_rank. This indicates that while target price upside possesses informative content, its predictive stability remains comparatively muted.
Quintile return distributions show that Quintile 5 (highest 20% implied upside) generates positive forward excess return, yet does not distinctly outpace Quintile 4, failing to establish a clean monotonic pattern. This suggests that markets discount extreme target prices; high implied return names frequently carry elevated operational uncertainty, illiquidity, or fundamental headwinds, curbing factor consistency.
Moreover, this factor exhibits noticeable return volatility, with outsized returns clustered heavily in post-correction market rebounds, rendering cumulative performance sensitive to specific months. Another key driver stems from the 12-month trailing eligibility window: over a full year, stock prices often fluctuate substantially, causing older target prices to lose timeliness and impairing average implied return efficacy.
Overall, compared to recommendation scores, target price implied returns convey directional cues but exhibit restricted cross-sectional explanatory strength and stability.
Figure 2: Quintile Mean Monthly Returns for ‘Average Implied Return’ (ir_rank)
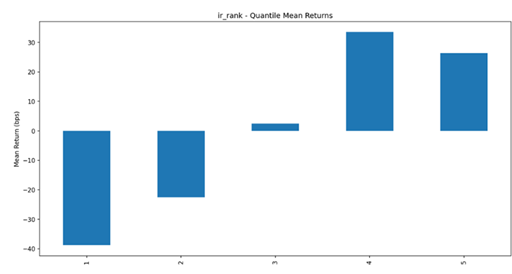
Note 1: Quintile 5 represents the top 20% highest average implied returns.
Note 2: Quantile returns are demeaned relative to the cross-sectional mean (Alphalens configuration: Demeaned=True).
Revision Dimension
The Revision dimension captures dynamic analyst adjustments over time, tracking upward and downward revisions in target prices and investment ratings. Unlike static levels, revision metrics track the velocity of information propagation and expectation updates, theoretically functioning as momentum or expectation correction signals.
This study assesses two representative revision factors: Implied Return Revision (rev_ir_rank) and Recommendation Score Revision (rev_rating_rank), examining whether the magnitude of analyst rating adjustments predicts future returns.
However, empirical testing encountered a key structural constraint: revision factors cannot support effective quantile sorting. Most analysts do not adjust ratings on a monthly cadence, leaving the cross-sectional distribution heavily clustered at zero. Consequently, the majority of stocks see no revisions in most months, yielding an extremely sparse, discrete distribution that cannot form continuous rankings.
Under these conditions, conventional quintile sorting fails to segment portfolios reliably, preventing the construction of economically meaningful portfolios. In the Taiwan market structure, relying solely on analyst revisions as standalone momentum factors cannot generate robust quant signals. Future work may address this via extended lookback horizons, event-driven definitions, or multi-source composite modeling.
Dispersion Dimension
Dispersion measures the heterogeneity of target price estimates across brokers for a given security. We define it via the Coefficient of Variation (target price standard deviation divided by mean target price) to standardize dispersion across price levels. Economically, low dispersion indicates consensus convergence, while high dispersion signals substantial analyst disagreement, reflecting information uncertainty or divided expectations.
Target Price Dispersion (disp1)
Empirical results indicate that disp1 yields a mean IC of 0.0104 and an ICIR of 0.0679, reflecting relatively weak performance and highlighting the limited standalone predictive capacity of target price dispersion.
Notably, quintile returns reveal a counter-intuitive phenomenon: the low-dispersion basket (Quintile 5) suffers negative average returns, whereas the high-dispersion basket (Quintile 1) generates superior positive returns. In the Taiwan stock market, dispersion does not merely represent a classical risk-compensation proxy, but connects deeply with momentum mechanics.
Specifically, during robust momentum rallies or emerging thematic cycles, analysts update target prices asynchronously: aggressive brokers swiftly upgrade targets while conservative counterparts lag, temporarily elevating dispersion. Consequently, high dispersion frequently aligns with enduring price momentum, allowing Quintile 1 to capture outsized short-term (1-month) returns. Conversely, low dispersion stocks often represent post-hype consolidation or faded themes lacking catalyst momentum.
In this empirical setting, dispersion behaves primarily as an indicator of asynchronous information updates or momentum lifecycle stages rather than a conventional uncertainty risk metric.
Figure 3: Quintile Mean Monthly Returns for ‘Target Price Dispersion’ (disp1)
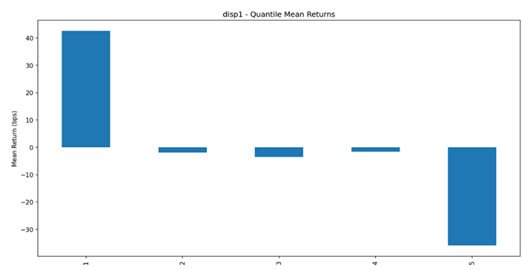
Note 1: Quintile 5 represents the lowest 20% target price dispersion (highest agreement).
Note 2: Quantile returns are demeaned relative to the cross-sectional mean (Alphalens configuration: Demeaned=True).
Breadth Dimension
Breadth gauges the breadth of analyst optimism across the sell-side community, capturing institutional consensus agreement and coverage breadth. We construct the Net Optimistic Analyst Ratio (noa2) to capture signals when fragmented views crystallize into broad consensus.
Net Optimistic Analyst Ratio (noa2)
The calculation for noa2 is formulated as follows:
(Brokers with Rating ≥ 4 − Brokers with Rating ≤ 2) / Total Broker Coverage Count
This netting formulation balances opposing bullish and bearish calls, filtering directional sentiment noise to extract net bullish consensus conviction.
Empirical metrics show noa2 delivers a mean IC of 0.0162 and an ICIR of 0.1877, marginally trailing Level factors but demonstrating respectable cross-sectional predictive capability.
The quintile return pattern reveals a non-linear characteristic: Quintile 4 (moderately high optimism) delivers higher average returns than Quintile 5 (highest optimism), deviating from ideal monotonic linearity.
This divergence illustrates the saturation trap of breadth metrics during bull runs. In exuberant markets or across large-cap bellwethers, analysts widely issue favorable ratings, pushing noa2 close to its theoretical ceiling. This generates significant ties across names and weakens cross-sectional differentiation.
Hence, noa2 functions best as a consensus filter rather than an isolated alpha driver. Its core utility lies in identifying securities entering broad optimistic consensus, complementing continuous Level or Dispersion factors to sharpen portfolio signal fidelity.
Figure 4: Quintile Mean Monthly Returns for ‘Net Optimistic Analyst Ratio’ (noa2)
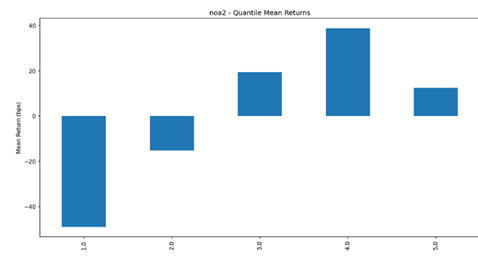
Note 1: Quintile 5 represents the top 20% highest net optimistic analyst ratios.
Note 2: Quantile returns are demeaned relative to the cross-sectional mean (Alphalens configuration: Demeaned=True).
Composite Factor Construction
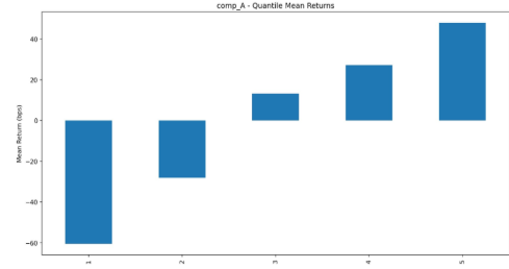
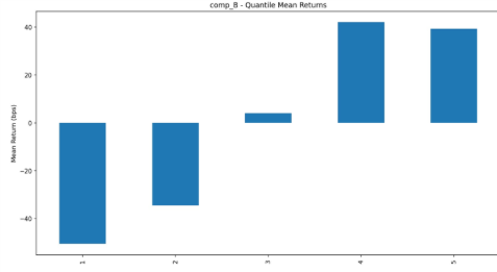
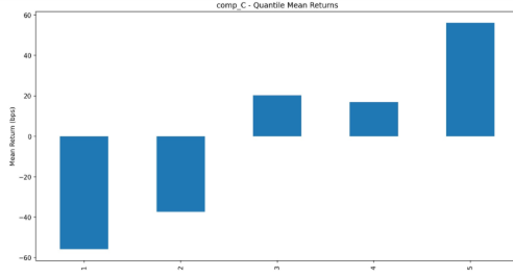
Synthesizing single-factor results shows that stocks with higher recommendation scores, elevated target price dispersion, and broad net optimistic coverage deliver superior forward returns. However, single factors remain vulnerable to distribution skewness, sparsity, and idiosyncratic noise.
To bolster factor robustness and informational synergy, this study intersects three dimensions—Level, Breadth, and Dispersion—to construct five composite factors, capturing complementary cross-signals and enhancing Alpha stability and reproducibility.
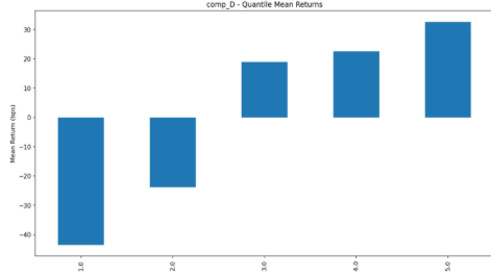
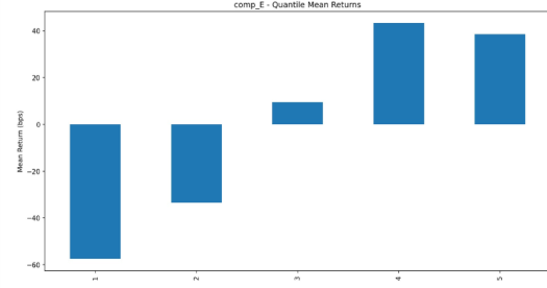
Table 3 details the architecture and economic rationale of the five composite factors. Multi-dimensional integration yields enhanced return monotonicity across quintiles, validating that combining multi-source consensus data strengthens cross-sectional sorting.
Table 3: Composite Factors Examined in this Study
| Composite Factor | Factor Name | Underlying Single Factors | Sorting Logic (Quintile 5) |
| comp_A | Recommendation Score × Dispersion | rating_rank, disp1 | High recommendation score, High dispersion |
| comp_B | Implied Return × Dispersion | ir_rank, disp1 | High implied return, High dispersion |
| comp_C | Optimism Breadth × Dispersion | noa2, disp1 | High optimism, High dispersion |
| comp_D | Recommendation Score × Optimism Breadth | rating_rank, noa2 | High recommendation score, High optimism |
| comp_E | (Score + Return + Optimism)³ × Dispersion | rating_rank, ir_rank, noa2, disp1 | High (Score + Return + Optimism), High dispersion |
Note: Composite Factor Ranking = Rank(Factor 1 Rank × Factor 2 Rank)
Figure 5: Quintile Mean Monthly Return Analysis for Composite Factors
Following standalone and composite factor testing, this study utilizes ICIR (Information Coefficient Information Ratio, defined as Mean IC divided by IC Standard Deviation) as the primary ranking benchmark to evaluate cross-sectional predictive stability, serving as the core factor selection criterion for subsequent strategy execution. Whereas Mean IC gauges average predictive strength, ICIR captures consistency across market cycles, making it the superior benchmark for production-grade quant strategies.
Several key takeaways emerge from Table 4. First, among single factors, Level factors distinctly outperform Dispersion, with Average Investment Recommendation Score (rating_rank) logging the top ICIR, proving that analyst rating levels track future performance more stably than price variance. Second, comparing Breadth and Level, Net Optimistic Analyst Ratio (noa2) scores higher in ICIR than Average Implied Return (ir_rank), verifying that multi-broker consensus breadth outperforms target price upside in stability.
Among composite factors, comp_D (Recommendation Score × Optimism Breadth) emerges as the top performer, achieving the highest ICIR across all evaluated factors. This confirms that pairing rating conviction with market breadth significantly boosts signal robustness. Moreover, comp_D demonstrates clear monotonic progression across quintiles, evidencing consistent cross-sectional ranking efficacy.
Notably, while comp_D’s top-quintile monthly excess return (+33 bps) is slightly lower than dispersion-driven composites like comp_A and comp_C (+48 to +55 bps), its definitive edge lies in minimal signal noise and superior consistency. By enforcing synchronized broker upgrades and high consensus breadth, comp_D effectively screens out speculative momentum names driven by isolated target price spikes, ensuring long-term portfolio stability.
In conclusion, empirical findings reveal that chasing headline return magnitude in broker consensus data does not yield optimal consistency. Multi-dimensional composite factors—most notably the consensus-consistency factor comp_D—excel in both ICIR and return monotonicity, establishing comp_D as the optimal core factor for live backtesting and strategy deployment.
Table 4: Mean IC and ICIR Performance of Evaluated Factors
| Dimension | Factor Name | Code | Mean IC | IC Std | ICIR |
| Composite | Recommendation Score × Optimism Breadth | comp_D | 0.0200 | 0.0919 | 0.2179 |
| Level | Average Investment Recommendation Score | rating_rank | 0.0191 | 0.0907 | 0.2109 |
| Breadth | Net Optimistic Analyst Ratio | noa2 | 0.0162 | 0.0862 | 0.1877 |
| Level | Average Implied Return | ir_rank | 0.0154 | 0.1141 | 0.1346 |
| Composite | Optimism Breadth × Dispersion | comp_C | 0.0148 | 0.1462 | 0.1009 |
| Composite | Recommendation Score × Dispersion | comp_A | 0.0128 | 0.1433 | 0.0890 |
| Composite | (Score + Return + Optimism)³ × Dispersion | comp_E | 0.0128 | 0.1502 | 0.0852 |
| Dispersion | Target Price Dispersion | disp1 | 0.0104 | 0.1538 | 0.0679 |
| Composite | Implied Return × Dispersion | comp_B | 0.0099 | 0.1484 | 0.0667 |
[Disclaimer] This research is intended solely for academic discussion and quantitative factor strategy testing. The content does not constitute investment advice, trading recommendations, or product sales solicitation.
🚀 How does comp_D perform in live trading? Read Part 2: Live Backtesting now!