

Theoretical Foundation of O’Shaughnessy’s Cornerstone Value Strategy
James P. O’Shaughnessy is the President and Portfolio Manager of O’Shaughnessy Capital Management, Inc. and O’Shaughnessy Funds, Inc. He is the author of several investment classics, including Invest Like the Best (1994), What Works on Wall Street (1997), and How to Retire Rich (1998). Among these, What Works on Wall Street stands out as a widely acclaimed bestseller in the United States.
In What Works on Wall Street, O’Shaughnessy conducted a rigorous analysis of performance across tens of thousands of companies using 44 years (1950–1994) of financial data from the S&P and Compustat databases. He initially focused on a ‘Market Leaders’ stock universe—excluding foreign stocks, utilities, and over-the-counter (OTC) shares. His empirical findings demonstrated that market returns do not fully conform to the Efficient Market Theory. Instead, the market persistently rewards stocks exhibiting specific characteristics while punishing others. Based on these insights, O’Shaughnessy proposed an evidence-based investment methodology: selecting stocks with low Price-to-Book (P/B), low Price-to-Cash Flow (P/CF), and low Price-to-Sales (P/S) ratios significantly enhances long-term investment returns.
Among his methodologies, the ‘Cornerstone Value Strategy’ is renowned for its disciplined multi-factor screening logic. Rather than searching for obscure, unloved micro-caps, it focuses on large-cap, high-revenue, cash-rich enterprises trading at reasonable valuations. Ultimately, it ranks candidate stocks by dividend yield to select holdings with the highest return potential.
This research paper transposes the strategy to the Taiwan Stock Market, utilizing listed and OTC common stocks as the investment universe (excluding the financial sector). Through six quantitative screening filters and an annual rebalancing protocol, we evaluate the long-term empirical performance of the Cornerstone Value Strategy in the Taiwan equity market. The core source of strategy Alpha stems from simultaneously incorporating four dimensions: ‘Size’, ‘Cash Flow Quality’, ‘Revenue Scale’, and ‘Relative Valuation’. This multi-dimensional framework prevents severe overall strategy volatility when a single factor underperforms. Meanwhile, utilizing dividend yield ranking as the final selection mechanism seamlessly balances both value and shareholder yield.
Empirical Validation of O’Shaughnessy’s Cornerstone Value Strategy in Taiwan Equities
Cornerstone Value Strategy Logic
The stock selection workflow of the Cornerstone Value Strategy proceeds in two stages: first, narrowing down the candidate universe via six quantitative filters; second, ranking the surviving constituents by dividend yield from highest to lowest, selecting the top 30 stocks to form the annual portfolio.
The six quantitative screening criteria are detailed as follows:
- Criterion 1: Large-Cap Stocks (Market Cap > Market Average Market Cap) – Selects only companies whose market capitalization exceeds the current cross-sectional market average. This ensures portfolio holdings possess sufficient scale and liquidity while mitigating slippage risks inherent to small-cap stocks.
- Criterion 2: Positive Cash Flow (Operating Cash Flow Per Share > 0) – Requires operating cash flow per share from operating activities to be positive. This filters out paper-profitable firms that are actually burning cash, ensuring holdings maintain genuine earning capacity.
- Criterion 3: Low Cash Flow Valuation (P/CF < Market Average P/CF) – Calculates the Price-to-Cash Flow ratio (P/CF = Market Cap / Quarterly Operating Cash Flow) for each stock and requires it to be below the current market average, focusing on relatively undervalued cash-flow-generating enterprises.
- Criterion 4: Normal Common Stock Shares (Common Stock Shares > 0) – Basic data validity check to exclude targets with abnormal capital structure or special share data.
- Criterion 5: High-Revenue Enterprises (Sales Per Share > 2.5x Market Average) – O’Shaughnessy’s definition of ‘Sales Giants’ mandates that a company’s sales per share significantly exceed the market average, ensuring holdings possess substantial business scale and solid revenue foundation.
- Criterion 6: Low Sales Valuation (PSR < Market Average PSR) – Requires the Price-to-Sales Ratio (PSR) to be below the current market average. Combined with Criterion 5, this forms a dual screening logic of ‘High Revenue at Reasonable Valuation’.
- Final Selection: Ranked by Dividend Yield, Selecting Top 30 Stocks – After passing the six screening criteria, candidate stocks are ranked by dividend yield from highest to lowest. The top 30 stocks are selected for equal-weight portfolio construction, with rebalancing executed annually at the beginning of July.
Data Source & Setup Parameters
- Data Source: TEJ Investment Database, comprising fundamental data for Taiwan listed/OTC common stocks and benchmark index IR0001.
- Sample Universe: Taiwan listed/OTC common stocks (excluding financial sector), fundamental data starting from 2019-01-01.
- Backtest Period: 2022-07-01 to 2025-05-29
- Rebalance Frequency: Rebalanced once annually at the beginning of July (Annual Rebalance)
- Position Allocation: Equal-weight allocation across top 30 stocks, baseline weight of 3.33% per stock.
- Initial Capital: NTD 1,000,000
- Transaction Costs: Buy: 0.1425% commission; Sell: 0.1425% commission + 0.3% Securities Transaction Tax; Minimum transaction cost: NTD 20.
- Slippage Costs: Single transaction volume cannot exceed 2.5% of daily volume, with market impact estimated using a 5% price impact coefficient.
- Leverage Limits: No mandatory leverage ceiling; actual leverage approximately 0.97.
Backtest Results of Cornerstone Value Strategy in Taiwan Equities ⭐
This backtest spans from July 2022 to May 2025, covering approximately 33 months across three complete annual cycles. During this timeframe, the Taiwan equity market traversed the 2022 bear market correction, the robust 2023 rebound, and the 2024 AI rally. Market regimes shifted multiple times, providing a comprehensive stress-testing environment for the strategy. According to final performance statistics, the Cornerstone Value Strategy significantly outperformed the TAIEX benchmark during the sample period, delivering an annualized return of 25.67% versus 17.80% for the broader market, while exhibiting a smaller maximum drawdown—demonstrating superior downside risk control alongside excess return generation.
Metrics
strategy
Benchmark
Annual return
25.67%
17.79%
Cumulative returns
89.52%
58.13%
Annual volatility
18.00%
20.60%
Sharpe Ratio
1.36
0.90
Sortino Ratio
1.88
1.25
Max Drawdown
-23.98%
-27.72%
Alpha
11%
—
Beta
0.75
—
【Figure 1: Cumulative Return Curve (Equity Curve)】
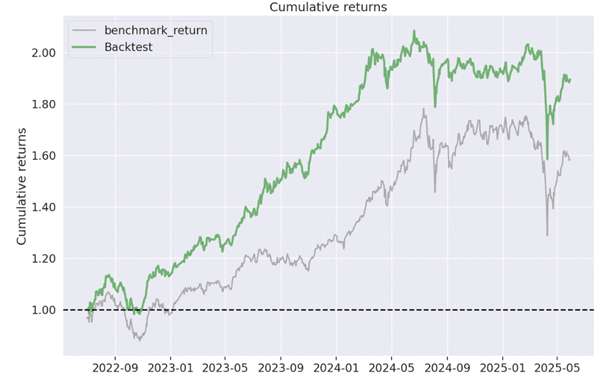
Examining the cumulative return curve, the strategy consistently maintained an alpha advantage over the broader market throughout the backtest period. During the 2023 market recovery, the strategy matched the upward momentum and continued generating excess returns through 2024. In early 2025, when systemic risks flared due to Trump’s ‘Reciprocal Tariff’ policies, the strategy experienced downside pressure alongside the benchmark. However, benefiting from concentration in large-cap high-cash-flow names, its drawdown (-23.98%) was noticeably milder than that of the TAIEX (-27.72%). This reflects that large-cap, high-yield value equities exhibit persistent Alpha characteristics within the Taiwan market.
【Figure 2: Drawdown Chart (Underwater Plot) & Annual Return Distribution】
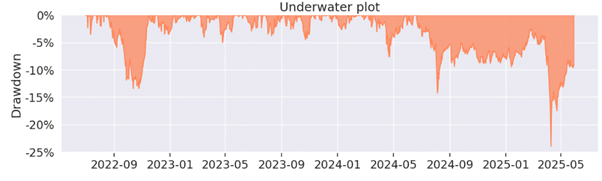
The maximum drawdown of the strategy was -23.98%, lower than the benchmark’s -27.72%, demonstrating that stock selection criteria grounded in large-cap, high-revenue shares provide downside resistance during systemic risk events. A Beta of 0.75 indicates lower sensitivity to overall market fluctuations, helping reduce systemic risk exposure. Furthermore, the strategy achieved a Sharpe Ratio of 1.36 and a Sortino Ratio of 1.88, implying that downside volatility is significantly lower than upside volatility (exhibiting positive skewness). Thus, excess returns are primarily driven by upside capture rather than excessive risk-taking.
Performance Interpretation & Model Optimization Suggestions
Interpretation of Backtest Results
The most notable aspect of these results is that excess returns were achieved alongside lower volatility and smaller drawdowns—a rare phenomenon in Long-only equity strategies. Generally, pursuing higher returns requires absorbing higher risk; however, the strategy’s annualized volatility (18.00%) was lower than the market’s (20.60%), and its maximum drawdown (-23.98%) was superior to the benchmark (-27.72%). The root cause lies in the stock selection rules, which naturally screen out highly volatile, over-leveraged, or cash-unstable enterprises.
A Beta of 0.75 is another key highlighting factor, indicating low overall correlation with the broad market—meaning if the market declines by 10%, the strategy is expected to decline by only ~7.5%. This stems from two mechanisms: first, portfolio holdings are concentrated in mature, large-cap firms with defensive characteristics; second, the six filters exclude a vast number of high-Beta cyclical stocks and high-P/E growth stocks, rendering the portfolio more resilient during market turbulence.
An Alpha of 11% confirms that after deducting systemic market returns, the strategy still generates substantial security-selection alpha. This proves that the combined effect of the six conditions is not merely ‘buying large caps,’ but identifying a specific sub-group within large caps characterized by fair valuations, healthy cash flows, and strong capital return commitment.
It is worth noting that the Kurtosis reached 12.73 and Skew was -1.03, indicating fat-tailed and left-skewed return distributions: routine daily volatility remains mild, but occasional extreme single-day drawdowns can be larger than expected under a normal distribution. Investors should understand that this strategy does not compound linearly day-to-day, but operates smoothly most of the time while occasionally absorbing sharp short-term pullbacks.
Strategy Limitations & Potential Risks
As a Long-only strategy with annual rebalancing, its capability to react to short-term market regime shifts is limited. If a severe market downturn occurs in non-rebalance months, the strategy cannot actively reduce exposure, causing holdings to absorb full downside volatility until the next rebalancing date.
Furthermore, the criterion requiring ‘Sales Per Share > 2.5x Market Average’ tends to concentrate holdings in a few high-revenue industries given Taiwan’s market structure (e.g., EMS/electronics manufacturing, semiconductor supply chain). When a specific sector enters a downcycle, the portfolio may face sector concentration risk.
Additionally, while dividend yield ranking captures mature, steady-payout firms, a high yield does not guarantee dividend sustainability. If a company inflates its yield via non-recurring income or special capital restructurings but slashes payouts the following year, portfolio quality will degrade.
Lastly, the empirical backtest covers a 33-month window with only 3 actual rebalancing cycles under annual turnover. The statistical sample size is relatively limited, and the robustness of performance metrics warrants validation across longer time-series data.
Feasible Quantitative Optimization Directions
Based on empirical findings, if the Cornerstone Value Strategy is to be live-executed in the Taiwan stock market, the first recommended optimization is dynamically calibrating the ‘High Revenue’ threshold. Currently utilizing a fixed 2.5x market average threshold, it can be transitioned to a rolling percentile (e.g., top 20th percentile). This allows screening criteria to adapt automatically to structural market shifts, preventing the candidate pool from becoming excessively large or narrow due to macro market fluctuations in specific years.
The second direction is introducing sector diversification constraints. Setting a single-industry cap among the final 30 holdings (e.g., max 6 stocks, or 20%) prevents stock selection from clustering heavily in high-revenue tech sub-sectors, enhancing cross-industry diversification.
Thirdly, incorporating dividend sustainability filters. Before ranking by dividend yield, implementing payout ratio thresholds or 3-year dividend consistency checks as pre-filters ensures selected constituents maintain historical payout integrity, reducing exposure to ‘Yield Traps’.
Furthermore, executing sensitivity analysis. Parameter sweeps across portfolio stock count, revenue threshold multiples, and rebalancing months will clarify performance sensitivity to specific settings and confirm results are not driven by hyper-parameter over-fitting.
Finally, conducting ablation studies to isolate the marginal contribution of each filter—specifically comparing the final dividend yield ranking against a random equal-weight baseline, as well as testing incremental performance gains as each of the six filters is added sequentially. This will isolate the true source of excess return.
TEJ Quantitative Database: Key Data to Overcome Look-Ahead Bias
| TEJ Quantitative Database Assurance The ultimate pitfall in quantitative backtesting is the utilization of ‘future data’. The core advantage of the TEJ Quantitative Database resides in its robust Point-in-Time (PIT) architecture. This guarantees that recorded figures represent exact historical numbers and timestamps as originally reported to the public—not post-restated or revised data. Through PIT datasets, backtests accurately reflect information truly available to market participants at that exact point in time, completely eliminating ‘Look-ahead Bias’ and granting backtested performance exceptional real-world validity. |
Disclaimer: The content of this document is strictly for academic research and educational exploration purposes and does not constitute any form of investment advice.