

Insights
In-depth research and data-driven insights on quantitative finance, factor investing, risk, and ESG from the TEJ research team.
Trending
Editor's picks from our research desk.

Fundamental Factor Research: Monthly Revenue Information – part1
The Taiwan equity market possesses a rare institutional advantage globally: under the Securities and Exchange Act, listed companies are required to announce and report their operational results for the preceding month by the 10th of each month (Exception: starting from FY2026, insurance companies and entities with insurance subsidiaries may extend their disclosure deadline to the 15th of each month). This is commonly referred to in the market as "Monthly Revenue".
Factor Research – Tracking Smart Money Footprints via Foreign Institutional Concentration – QFII Part 1
Track QFII ‘smart money’ footprints in Taiwan large-cap stocks! Learn how the Foreign-Institutional Trading Concentration (conc_qfii) factor predicts returns.

Empirical Research on Behavioral Factors in the Taiwan Stock Market: A Case Study of the Share Distribution
In an AI-driven Taiwan stock market, mastering chip distribution (ownership structure) is the key to profitability. This study delves into the Share Distribution data from the TDCC, transforming 15 tiers of shareholding data into behavioral finance factors such as investor attention, opinion dispersion, and retail speculation. By utilizing Fama–MacBeth two-stage regression and the alphalens-tej quantitative tool, we precisely validate the predictive power of psychological biases on stock returns, providing investors with actionable Alpha strategies and robust risk management solutions.
Insights
Browse all articles by topic.
 Industry Insights
How ChatGPT Expose Enterprises’ Achilles’ Heel
Not all companies can utilize ChatGPT for AI-driven transformation, and ignoring information security risks may affect their sustainability.
 Quant Data Science
PCA Feature Portfolio
Principal Component Analysis (PCA) is a key technique in unsupervised learning widely used in machine learning and statistics to analyze data and reduce data dimensionality. Its core idea is to break down the original data into representative principal components, achieving dimensionality reduction and providing a new description of the data.
 Quant Data Science
Seeking Alpha
The alpha obtained from the Fama&French three-factor model is used to construct a long-short strategy and backtest the performance against the market return. Highlights: Difficulty:★★☆☆☆ The Fama&French three-factor model is used to calculate the alpha of Taiwan-listed stocks, and the top 20% of stocks with the highest alpha and the bottom 20% of stocks with […]
 Event & Alternative Signals
ESG Investment Portfolio (Part I)
In recent years, various asset management companies have launched ESG-related ETFs, such as the pioneering Fubon Corporate Governance ETF (00692), which focuses on the top 100 companies in Taiwan in terms of corporate governance, and the Cathay Sustainable High Dividend ETF (00878), which combines high dividend yields with sustainability criteria. The common thread among these ESG ETFs is their tracking of ESG indices introduced by domestic and international index providers. While each ESG ETF specializes in different areas, they all rely on ESG screening criteria, emphasizing sustainable business practices among their constituent stocks, allowing investors to invest in assets that balance environmental sustainability and robust growth potential.
 Quant Research
Price Deviation Ratio Trading Strategy
Create a price deviation ratio trading strategy using python and perform historical backtesting. Summary of Key Points in This Article Article Difficulty: ★☆☆☆☆ Calculate the N-day Price Deviation Ratio Indicator using unadjusted closing prices of individual stocks and use the N-day previous low and high prices as entry and exit signals. Reading Recommendation: This article […]
 Quant Research
LSTM Trading Signal Detection
In the previous article, we used an LSTM model to predict stock price trends by using the past 10 days’ opening prices, highest prices, lowest prices, closing prices, and trading volumes to predict the closing price for the next day. However, we observed that the model’s performance was not very satisfactory when relying solely on yesterday’s stock price to predict tomorrow’s price. Therefore, we have decided to change our approach. This time, we aim to use the model to help us identify buy and sell points and formulate a trading strategy. We have also incorporated eight new feature indicators, with four being technical indicators and four being macroeconomic indicators, in the hope of improving our prediction results using these two facets of feature values.
 Quant Research
Analysis of the chip concentration
Taiwan’s stock market is a shallow dish market. A shallow dish means it has no depth and is susceptible to external shocks. In contrast, the stock market is easily disturbed by external forces. It has significant ups and downs, such as being influenced by news or large purchases of a single stock by large investors, which can significantly affect stock price performance. This article uses several chip data to explore the impact on stock prices when chips are concentrated in stock and presents them in an interactive chart.
 Quant Research
National Stabilization Fund Performances
An Introduction to National Stabilization Fund and its hot stocks’ performances Keyword:Quant analysis、National Stabilization Fund、Protection Performance Highlights Difficulty: ★☆☆☆☆ Preface In 2022, under the unstable background caused by the Ukrainian-Russian War and high inflation, rising prices suppressed consumers’ purchasing power, which made a great influence on companies’ profits. As a result of this, people were […]
 Quant Research
Kenneth L. Fisher Growth Stocks Strategy
We use Python to backtest Kenneth L. Fisher’s growth stocks strategy on the Taiwan stock market. Keyword: Kenneth L. Fisher、Growth Stocks、Strategy Backtest What is Kenneth Fisher’s Growth Stocks Strategy? Kenneth L. Fisher, founder and president of Fisher Investments, and his father Philip A. Fisher, a representative of Qualitative Investment in the United States. Warren Buffett […]
 Quant Data Science
Herding indicators
Using the number of margin trading and short selling and volume to establish the herding indicators then analyze by regression model. Keyword:Herding Indicators、Margin Trading、Application What are Herding indicators? The emergence of behavioral finance has challenged the traditional view in investment theory that individuals make rational investment decisions. The “herd behavior” represents the tendency of investors […]
 Quant Research
Monthly sales growth rate application strategy
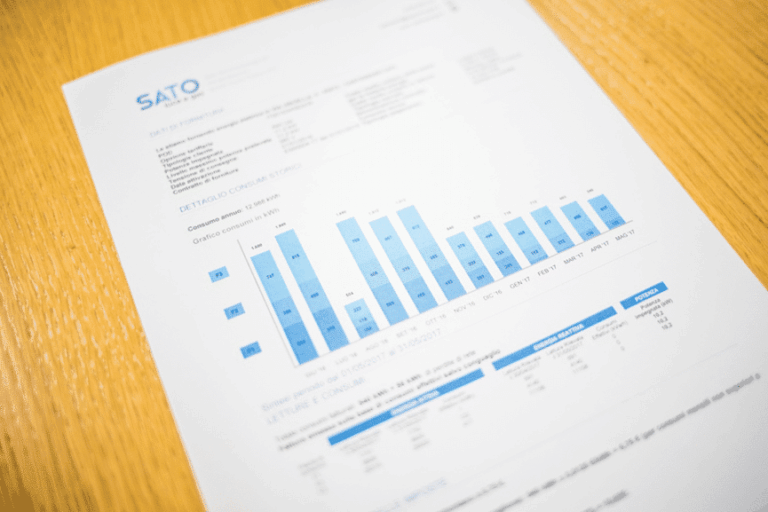
We use yoy and mom of monthly sales of Taiwan listed companies to establish strategies and observe the win rate and return. Keyword:Application、Monthly sales、Backtesting Highlights Difficulties: ★★☆☆☆We use yoy and mom as our buy&sell point for trading strategy.Advice: The backtesting framework in this paper can refer to 【Quant】 Market strength indicator trade. For readers who are […]
 Quant Research
Market strength indicators trade
Use market strength indicators cross strategy to backtesting Highlights Difficulty:★★☆☆☆ Use market strength indicators to do the moving average cross investment strategy Advice:We use various technical indicators and strict long & short filter condition to judge the numbers of stocks strength and calculate market long short indicators. Using moving average cross strategy and visualization trading […]