

Introduction: Moving from Factor Testing to Live Backtesting
The ‘broker consensus data’ examined in this study aggregates target price forecasts and investment recommendation (rating) information from various securities brokerages across the market. By consolidating the collective wisdom of analysts, it aims to eliminate the extreme forecast biases of individual brokers and provide objective forward-looking market expectations.
Findings from Part 1 indicated that single factors—such as rating intensity (rating_rank) and breadth metrics (noa2)—are prone to rating clustering and distribution skewness; target price dispersion (disp1) acts as a short-term momentum catalyst; and revision factors suffer from sparse signals that limit their standalone stock selection utility. To overcome the vulnerabilities of single indicators to optimistic bias and idiosyncratic noise, this research implemented factor engineering to construct multi-factor cross-combinations.
Results demonstrated that the composite factor comp_D (Investment Recommendation Score × Net Optimistic Analyst Ratio)—which integrates both rating intensity and market bullish consistency—performed best. It effectively filtered out noise from isolated extreme reports, delivered a robust monotonically increasing return structure, and achieved the top Information Coefficient Information Ratio (ICIR) of 0.2179, confirming its dual advantage in win rate and signal stability.
This paper (Part 2) advances to live backtesting by deploying this top-performing comp_D factor into an event-driven execution framework. Incorporating realistic trading frictions (including Taiwan securities transaction tax, brokerage fees, and volume-based slippage constraints), we examine the strategy’s true return profile and drawdown resilience across the 2020–2025 bull-bear cycles. Crucially, this study provides an in-depth evaluation across different market liquidity stratifications (Top 100 to Top 600 universe) to identify the specific market structures where broker consensus Alpha demonstrates its greatest practical efficacy.
💡 Missed Part 1? Read [Part 1: Factor Testing] first!
Investment Strategy Construction
To validate the real-world feasibility and profitability of the evaluated factor, this study employs the event-driven Zipline framework to construct a monthly rebalanced quantitative stock selection strategy designed to mirror institutional execution workflows. The overarching architecture is outlined in Table 5.
The strategy adopts a Monthly Long-only Equal-weight design, rebalancing on the final trading day of each month and utilizing the composite factor comp_D (Recommendation Score × Optimism Breadth) as its primary selection metric. The stock selection workflow begins with market liquidity stratification: the 60-day simple moving average of daily turnover (Close Price × Volume) serves as the liquidity benchmark, filtering for the top N equities (N configured as 100, 200, 400, and 600). Following liquidity filtering, stocks are sorted by comp_D, and the top 20 equities are allocated in equal weights, with a 10% cash buffer reserved for operational liquidity.
Figure 6: Stock Selection Workflow Diagram
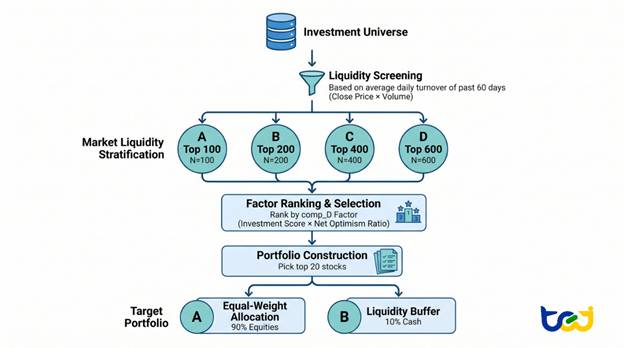
Additional backtesting specifications are detailed in Table 5:
Table 5: Live Execution Backtest Specifications
| Item | Specification |
| Strategy Type | Monthly Long-only Equal-weight |
| Factor Formulation | Composite factor comp_D (Recommendation Score × Optimism Breadth) as direct selection driver |
| Selection Universe | Initial screening for top N liquid stocks (N = 100, 200, 400, 600), followed by selecting the top 20 names with highest comp_D. Liquidity: 60-day simple moving average of daily turnover (Close × Volume) sorted descending to assess universe liquidity impact on performance. |
| Portfolio Weights | Equal weighting across selected equities; 90% total equity exposure (10% cash liquidity buffer) |
| Rebalance Frequency | Last trading day of each month |
| Initial Capital | NT$ 10,000,000 |
| Transaction Costs | Taiwan market standard fees: 0.1425% commission (with 40% institutional discount applied) + 0.3% securities transaction tax |
| Slippage Model | VolumeShareSlippage(volume_limit=1, price_impact=0) |
| Benchmark | IR0001 (Taiwan Weighted Total Return Index) |
| Backtest Period | 2020-01-01 ~ 2025-12-31 |
Deploying the composite factor into practical backtesting reveals a fundamental market dynamic: the efficacy of broker consensus factors is highly contingent on market liquidity. Within the Top 100 and Top 200 high-liquidity tiers, extensive institutional coverage, frequent report updates, and rapid information transmission allow collective analyst intelligence to price securities efficiently, generating performance that substantially outpaces the broader market. Conversely, when the selection pool expands to the Top 400 or Top 600, sparse coverage and update lags amplify information decay, diluting high-conviction signals and impairing strategy returns.
The empirical performance can be summarized into two primary observations:
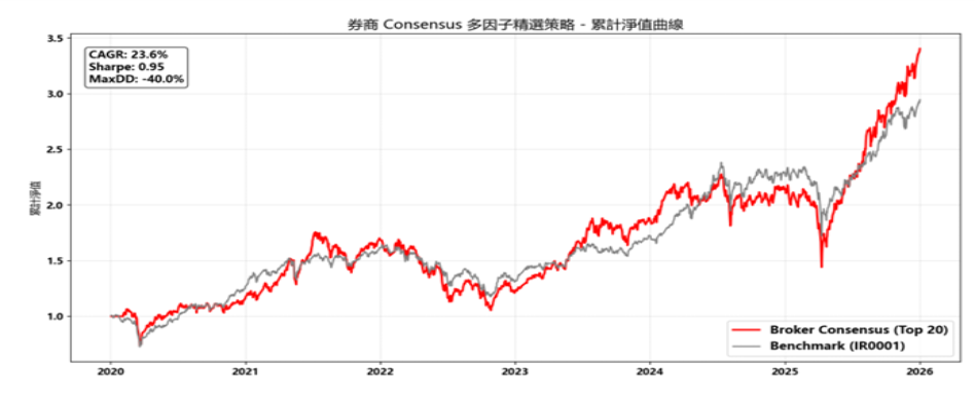
First, high-liquidity filtering is a critical prerequisite for Alpha generation. When strictly confined to the Top 100 liquidity universe, the strategy achieves a cumulative return of 240.52% and a CAGR of 23.57%, noticeably outperforming the benchmark index at 20.51%. However, as the liquidity threshold widens to the Top 400 and Top 600, annualized returns decline to 11.60% and 14.39% respectively, trailing the broader market. This confirms that broker consensus pricing power is concentrated in core institutional holdings, with explanatory power dropping sharply among mid-to-small cap or illiquid names.
Second, strategy performance reflects a distinct risk-return trade-off. While the Top 100 group records the highest absolute return and a Sharpe ratio of 0.95, it registers a maximum drawdown (MaxDD) of -40.04%, reflecting heightened volatility exposure. In contrast, the Top 200 universe achieves an equivalent Sharpe ratio of 0.95 with an annualized return of 22.98% and a reduced MaxDD of -38.49%, offering a more balanced risk-reward profile and presenting the most viable universe for institutional portfolio allocation.
Overall, empirical backtest results indicate that broker consensus factors do not possess universal market-wide efficacy; rather, they exhibit structural dependence, with Alpha heavily concentrated in liquid, information-dense market segments.
Table 6: Performance Comparison Across Liquidity Groups
| Liquidity Group (Top N) | Cumulative Return | Annualized Return (CAGR) | Sharpe Ratio | Maximum Drawdown (MaxDD) |
| Top 100 (Ultra-High Liquidity) | 240.52% | 23.57% | 0.95 | -40.04% |
| Top 200 (High Liquidity) | 231.28% | 22.98% | 0.95 | -38.49% |
| Market Benchmark (IR0001) | 194.58% | 20.51% | 1.05 | -28.55% |
| Top 400 (Mid-High Liquidity) | 88.77% | 11.60% | 0.61 | -37.76% |
| Top 600 (Broad Market Universe) | 117.74% | 14.39% | 0.74 | -34.26% |
Figure 7: Cumulative Performance of comp_D High-Liquidity Top 20 Selection Strategy
Conclusion
Through systematic factor engineering combined with Alphalens-tej cross-sectional evaluation and Zipline-tej backtesting frameworks, this study evaluates the empirical Alpha and operational viability of broker consensus data across the 2020–2025 multi-year market cycle. The findings yield three core conclusions:
Core Finding 1: Disagreement Catalyzes Short-Term Momentum; Single Factors Constrained by Skewness
In single-factor evaluations, absolute ratings (rating_rank) and breadth metrics (noa2) demonstrate predictive validity but encounter distributional skewness and rating clustering (ties), dampening cross-sectional sorting resolution. However, cross-factor combinations reveal that target price dispersion serves as a potent momentum catalyst: combinations like comp_A and comp_C demonstrate that when strong consensus coincides with expanding target price dispersion, short-term excess returns accelerate, reflecting momentum magnification during rapid price discovery.
Core Finding 2: Composite Factor comp_D Leads in Stability with Strict Monotonicity
Among composite factors, comp_D (Recommendation Score × Net Optimistic Ratio) achieves the highest stability and consistency, registering a study-wide top ICIR of 0.2179. By intersecting rating level with institutional conviction breadth, comp_D filters noise from isolated target price outliers and establishes a monotonically increasing return profile. Compared to the high-volatility spikes of dispersion-driven factors, comp_D serves as an optimal core selection driver for long-term systematic strategies.
Core Finding 3: Factor Efficacy Relies Heavily on Liquidity; Alpha Decays in Mid-to-Small Caps
Backtesting demonstrates that consensus factor validity is bound to market liquidity structure. Within the Top 100 and Top 200 liquidity tiers, dense sell-side coverage and swift institutional updates enable consensus data to price assets effectively, producing clear excess returns over the benchmark. Conversely, broadening exposure to mid-to-low liquidity names introduces coverage sparsity and update lags, accelerating signal decay and diminishing strategy Alpha.
Overall, the broker consensus factors constructed in this study exhibit moderate cross-sectional predictive power (mean IC ≈ 0.02, ICIR ≈ 0.22), indicating that while analyst consensus conveys directional insights, its standalone predictive strength and stability remain modest, making it insufficient as an isolated source of sustained Alpha. However, at the strategy execution level, the annualized return reaches 22.98%–23.57%, outperforming the benchmark’s 20.51% and demonstrating practical portfolio value, though a Sharpe ratio of 0.95 (vs. benchmark 1.05) highlights room for risk-adjusted optimization.
[Disclaimer] This research is intended solely for academic discussion and quantitative factor strategy testing. The content does not constitute investment advice, trading recommendations, or product sales solicitation.
From Single Signals to Multi-Factor Architecture: Practical Quantitative Deployment
This study confirms that single market expectation indicators are constrained by distributional skewness and signal noise, necessitating multi-dimensional factor synthesis paired with strict liquidity filters to construct resilient excess-return strategies. However, in practice, resolving multi-feature engineering and eliminating look-ahead bias introduces substantial operational overhead. Research teams can leverage the TEJ Factor Library, which is engineered entirely on a rigorous Point-in-Time (PIT) architecture and covers over 100 localized factors across 11 key categories, providing ready-to-use standardized datasets. Researchers can significantly accelerate multi-factor synthesis and Alpha discovery, seamlessly bridging research insights with live strategy execution.