

Photo by Apex Virtual Education on Unsplash
Preface
In the previous study, we verified the fundamental chip-analysis principle of “institutional/major players going momentum, retail investors going contrarian” in the Taiwan stock market, and identified the “Major Player Net Buying Strength (by Amount)” factor, which exhibited the highest winning rate and most stable performance. In this second part, we conduct backtests to evaluate the actual profitability of this major player factor across different holding periods, while analyzing how transaction fees and turnover rates impact final trading performance.
➡️Missing Part 1? Click here!⬅️
4. Factor Analysis
The previous section employed Fama-MacBeth (FM) regressions and portfolio analysis to test the cross-sectional predictive power of the factors. This section further investigates the relationship between the “Major Player Net Buying Strength (by Amount)” factor and expected stock returns. Unlike the weekly-frequency analysis in the previous section, this section utilizes daily factor values, enters positions at the next trading day’s closing price, and applies the stock universe screening criteria from Section 2.1. It evaluates the factor’s capacity to predict stock returns across three dimensions: factor performance, Information Coefficient (IC), and turnover rate.
4.1 Factor Performance Analysis
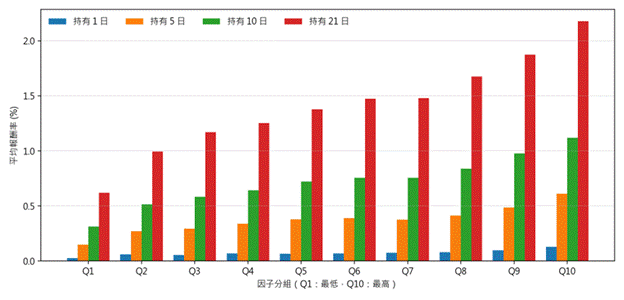
Factor performance analysis primarily utilizes factor rank-sorting to construct equal-weighted portfolios by quantile, observing whether a monotonic relationship exists between the average return and the ranking across different holding periods. Figure 4.1 demonstrates that when dividing the “Major Player Net Buying Strength (by Amount)” factor equally into 10 deciles and constructing equal-weighted portfolios for each decile, a clear monotonic increasing relationship is presented between average returns and decile rankings across holding periods of 1 day (blue bars), 5 days (orange bars), 10 days (green bars), and 21 days (red bars). Taking a 5-day holding period as an example, the average return of Decile 10 (Top group) is 0.61%, approximately 4.1 times that of Decile 1 (Bottom group) at 0.15%; for a 21-day holding period, the average returns for the Top and Bottom groups are 2.18% and 0.62%, respectively. This result not only indicates a positive relationship between major player net buying strength by amount and future stock returns, but also demonstrates that its predictive power can persist over a holding period of up to one month.
Figure 4.1 Average Return by Quantile for Major Player Net Buying Strength (by Amount) Factor
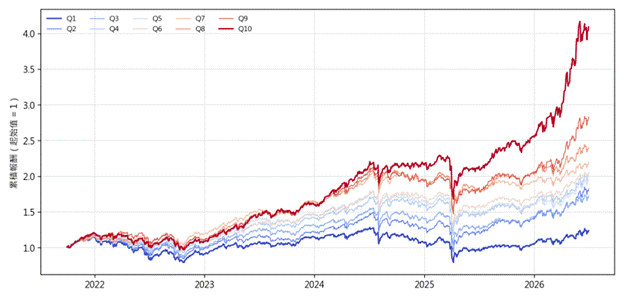
In addition to observing average returns, one can further analyze the time-series behavior of the portfolios’ cumulative returns by quantile. Figure 4.2 shows that stocks with daily factor values above the 90th percentile—namely the Decile 10 (Top group) portfolio—outperformed other deciles across most time points during the sample period, reaching an end-of-period cumulative Net Asset Value (NAV) of 4.09. Conversely, stocks with daily factor values below the 10th percentile—namely the Decile 1 (Bottom group) portfolio—consistently lagged behind other deciles, with an end-of-period cumulative NAV of only 1.24. Cumulative returns across deciles exhibit clear stratification according to factor ranking. It is worth noting that the performance spread between the Top group and other deciles widened significantly after the second half of 2025. Furthermore, the aforementioned cumulative returns do not deduct transaction costs; actual strategy performance still needs to be evaluated in conjunction with the turnover analysis in Section 4.3.
Figure 4.2 Cumulative Return by Quantile for Major Player Net Buying Strength (by Amount) Factor
4.2 Information Coefficient Analysis
The Information Coefficient (IC) is the Spearman rank correlation coefficient between factor values and future stock returns. An IC greater than 0 indicates a positive correlation between the factor and future stock returns, and vice versa. Table 4.1 shows that the average ICs of the “Major Player Net Buying Strength (by Amount)” factor across holding periods of 1, 5, 10, and 21 days are 0.0063, 0.0104, 0.0143, and 0.0224, respectively. All values are positive and increase as the holding period extends. The proportion of trading days with a positive IC also increases from 52.7% to 65.5%, while the Information Ratio (mean IC divided by IC standard deviation) rises from 0.08 to 0.32, indicating that the factor’s signal becomes more stable over medium-term holding periods.
Table 4.1 Information Coefficient Statistics for Major Player Net Buying Strength (by Amount) Factor
| Holding Period | Mean IC | IC Std Dev | Information Ratio | IC > 0 Ratio |
| 1 Day | 0.0063 | 0.0761 | 0.083 | 52.7% |
| 5 Days | 0.0104 | 0.0723 | 0.144 | 57.7% |
| 10 Days | 0.0143 | 0.0673 | 0.212 | 59.1% |
| 21 Days | 0.0224 | 0.0700 | 0.320 | 65.5% |
Figure 4.3 illustrates the monthly average heatmap of daily IC values for a 5-day holding period. Overall, the monthly average IC was positive in 35 out of 57 months, indicating a positive correlation between the factor and future stock returns across most months. However, it is worth noting that noticeably negative IC values occurred in a few months, such as July 2022 (-0.073), December 2025 (-0.042), and February 2025 (-0.035). This indicates that under specific market regimes, the positive relationship between major player net buying and subsequent returns may temporarily reverse, exerting a notable negative impact on portfolio profit and loss when using this factor as a stock selection criterion.
Figure 4.3 Monthly Average of Daily IC Values for Major Player Net Buying Strength (by Amount) Factor (5-Day Holding Period)
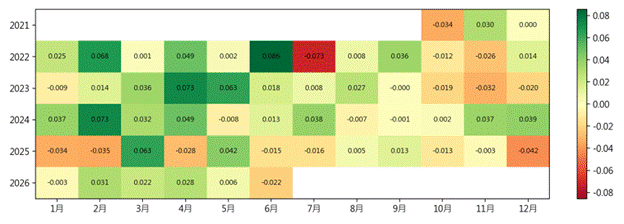
(Data period: 2021/10–2026/06)
4.3 Turnover Rate Analysis
The previous analysis of factor predictive power did not account for transaction costs such as brokerage commissions, securities transaction taxes, and slippage. In practical trading, however, transaction costs are a key determinant of a strategy’s success or failure. Therefore, this subsection conducts a turnover rate analysis to estimate the potential transaction costs incurred when constructing portfolios using this factor.
Turnover rate reflects the frequency of portfolio rebalancing; a turnover rate of 1x represents a complete turnover of the portfolio’s stock holdings. Table 4.2 shows that the average 5-trading-day turnover rates for the Top and Bottom group portfolios are approximately 35.3% and 33.6%, respectively. Under a weekly rebalancing scheme, the annualized turnover rates are approximately 17.8x and 16.9x, respectively. Meanwhile, the factor rank autocorrelation decreases from 0.95 at a 1-day lag to 0.22 at a 21-day lag. Overall, the rebalancing frequency is noticeably high.
Estimating conservatively with standard non-discounted round-trip commissions of 0.1425% each way and a securities transaction tax of 0.3%, the cost of a single complete turnover is approximately 0.585%. For the Top group, a weekly turnover rate of approximately 35.3% translates to a weekly transaction cost of roughly 0.21%, which is non-negligible compared to the 5-day average return of 0.61% for the Top group. Consequently, for practical applications, this study suggests extending the rebalancing period (e.g., bi-weekly or monthly), setting turnover buffer zones, or combining this factor with low-turnover factors to mitigate the erosion of strategy performance by transaction costs.
Table 4.2 Average Turnover Rate and Rank Autocorrelation by Quantile for Major Player Net Buying Strength (by Amount) Factor
| Lag Period | Top Group Turnover | Bottom Group Turnover | Top Group Annualized (x) | Bottom Group Annualized (x) | Factor Rank Autocorrelation |
| 1 Day | 18.9% | 17.4% | 47.55 | 43.93 | 0.946 |
| 5 Days | 35.3% | 33.6% | 17.77 | 16.95 | 0.824 |
| 10 Days | 60.2% | 57.7% | 15.17 | 14.55 | 0.519 |
| 21 Days | 77.7% | 74.8% | 9.33 | 8.98 | 0.224 |
This study evaluated the predictive power and tradability of the “Major Player Net Buying Strength (by Amount)” factor across three dimensions: factor performance, Information Coefficient, and turnover rate. The results indicate that the factor exhibits a positive relationship with future stock returns, strong monotonicity across quantile returns, and consistently positive IC values that improve with longer holding periods. However, its turnover rate remains high, requiring proper transaction cost controls in practical applications.
5. Conclusion
Using TEJ broker branch trading data, this study constructed 20 behavioral factors spanning six dimensions: capital flows, broker buying/selling strength, retail behavior, major player behavior, herding effects, and concentration/dispersion divergence, exploring the relationship between investor trading behaviors and expected stock returns in the Taiwan stock market. In terms of empirical methodology, this paper combined Fama-MacBeth regressions and portfolio analysis to test the predictive power of each factor, further evaluating the forecasting capability and practical tradability of representative factors. Based on the empirical findings above, this study summarizes three key conclusions:
- Fama-MacBeth regression results show that 15 out of the 20 factors exhibit significant predictive power for next-week stock returns, with coefficient signs aligning with theoretical expectations. Specifically, major player net buying strength, skewness of broker buying/selling strength, and relative Gini coefficient of seller branches demonstrate significant positive relationships; whereas difference in major player concentration (HHI), retail broker buying/selling strength, and broker herding indicators show significant negative relationships.
- Portfolio analysis results show that quantile returns for major player behavioral factors exhibit an increasing trend along factor rankings, indicating that directional net buying by major players carries a positive information advantage in Taiwan’s stock market. Conversely, retail investor and herding behavior factors measured by buyer count exhibit a decreasing return trend along factor rankings, reflecting the reversal characteristics following synchronized retail buying. Notably, the long-short hedged (H-L) portfolio constructed via “Major Player Net Buying Strength (by Amount)” achieved a weekly return of 0.47% (t = 6.07), ranking highest in statistical significance among all factors.
- Factor analysis reveals that quantile returns for the “Major Player Net Buying Strength (by Amount)” factor display monotonicity across all holding periods. For a 5-day holding period, the mean IC is 0.0104 with a positive IC ratio of 57.7%, and predictive power increases over longer holding periods. However, the factor’s weekly turnover rate is approximately 35%, making transaction costs a non-negligible factor.
Overall, most broker branch behavioral factors constructed in this study demonstrate strong predictive power for expected stock returns, whether tested via FM regressions, portfolio analysis, or factor analysis tools. This provides empirical support for the chip logic of “institutional/major players going momentum, retail investors going contrarian” in the Taiwan market. Furthermore, due to similarities in underlying data, a certain degree of multicollinearity may exist among specific factors; correlation filtering is advised prior to building multi-factor models.
Wanna know more about data?
Taiwan stock market’s “broker branch trading data” offers daily frequency along with unique advantages in precisely identifying trading entities and transaction directions, making it the most granular public data tool for observing chip flows and tracking “smart money” in Taiwan. Interested in verifying more chip factors yourself or developing your own high-win-rate strategy for Taiwan stocks?
➡️Visit the TEJ Broker Branch Trading Database now to access the high-quality data!