Table of Contents
Following our analysis in Part 1: Factor Research – Tracking Smart Money Footprints via Foreign Institutional Concentration, we have systematically verified that the foreign institutional trading concentration factor (conc_qfii) possesses robust and cumulative return predictive power within the large-cap universe. This article takes a practical perspective to transform our empirical findings into fully executable trading strategies. Utilizing an event-driven backtesting engine, we evaluate real-world feasibility by strictly deducting transaction costs and enforcing realistic trading limitations.
Based on the factor’s unique behavior, we transform it into actionable trading strategies. We embed explicit transaction costs, liquidity filters, and leverage caps into our event-driven engine, while simultaneously utilizing a point-in-time architecture to completely eliminate look-ahead biases. The detailed backtesting parameter configurations are outlined below:
We construct two strategy variations for empirical comparison. Both strategies follow the exact same core routine (Industry Neutralization → Market Cap Top 30% Large-Caps → Select Top 50 Stocks → Value-Weighted). They differ solely in the mathematical formulation of their final ranking scores.
The process of industry neutralization (subtracting the daily industry mean from an individual stock’s factor score) is vital to eliminate structural sector biases. Without industry neutralization, concentration rankings would heavily over-concentrate in a handful of industries with naturally higher foreign broker coverage (such as semiconductors); neutralization diversifies the portfolio’s sector risk exposures, which ultimately boosts risk-adjusted returns
Consequently, Strategy 2 defines its composite ranking score as:
Ranking Score = z (conc_qfii) – 0.5 x z(Disagree)
The negative sign inside the formula penalizes high disagreement. Strategy 2 aims to identify stocks that not only exhibit intense foreign concentration but also display low disagreement (cross-channel consensus), explicitly steering clear of stocks prone to institutional tug-of-wars.
Table 1: Factor Strategy Configurations
| Strategy Name | Strategy Type | Ranking Score Formulation |
|---|---|---|
| Strategy 1 (Pure Concentration) | Single Factor | z(conc_qfii) |
| Strategy 2 (Concentration + Disagreement Fusion) | Multi-Factor Fusion | z(conc_qfii) − 0.5 × z(Disagree) |
To protect our research from historical overfitting traps, we establish a demanding triad of performance hurdle rates: the Full-Sample Sharpe Ratio must exceed 1.256, the Out-of-Sample (OOS) Sharpe Ratio must exceed 1.668, and the annualized Alpha must be strictly greater than 0. These thresholds are set using the actual performance of the benchmark index (IR0078) over identical timeframes.
Table 2 and Figure 3 present the net performance metrics after accounting for all real-world transaction taxes, broker commissions, and slippage frictions:
Table 2: Backtesting Performance Metrics for conc_qfii Top 50 Large-Cap Value-Weighted Portfolio (Net of Costs)
| Performance Metric | Strategy 1 (Pure Concentration) | Strategy 2 (Concentration + Disagreement) | Benchmark Index (IR0078) |
|---|---|---|---|
| Annualized Return | 27.65% | 30.12% | 25.77% |
| Cumulative Return | 260.67% | 298.82% | 233.51% |
| Annualized Volatility | 21.59% | 21.33% | 19.83% |
| Sharpe Ratio (Full Sample) | 1.239 | 1.342 | 1.256 |
| Sortino Ratio | 1.868 | 2.022 | 1.799 |
| Max drawdown (MDD) | −31.03% | −26.51% | −28.60% |
| Annualized Alpha | +1.71% | +3.88% | — |
| Beta | 1.006 | 0.996 | — |
| Out-of-Sample Sharpe (OOS Sharpe) | 1.969 | 2.000 | 1.668 |
| Daily Average Turnover | 0.74% | 0.95% | — |
Figure 3: Cumulative Return Equity Curves of conc_qfii Top 50 Large-Cap Portfolio Variations vs. Benchmark Index (IR0078)
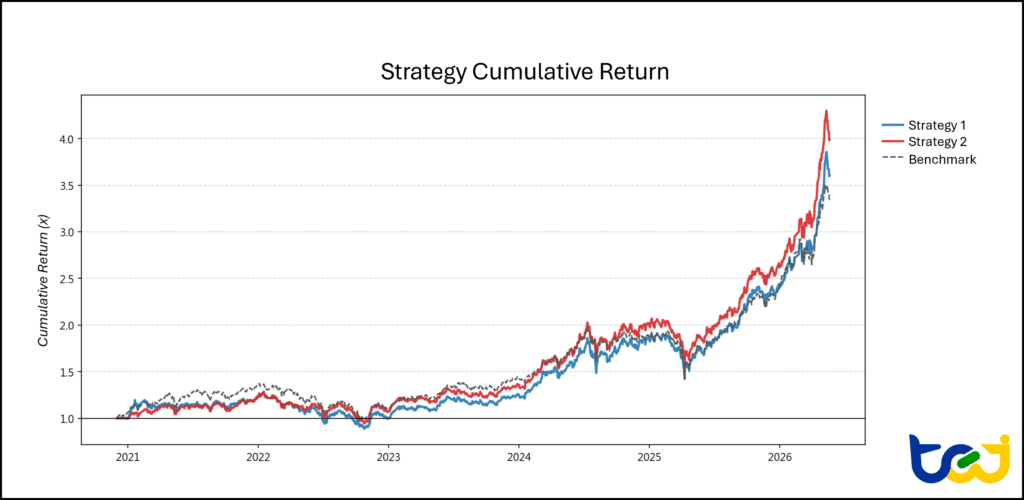
Dissecting Strategy Performance :
Relying solely on foreign institutional concentration rankings, Strategy 1 successfully satisfies two out of three criteria: first, its risk-adjusted performance during the Out-of-Sample (OOS) phase is outstanding, recording an OOS Sharpe Ratio of 1.969, beating the baseline hurdle of 1.668; second, it delivers a positive annualized Alpha of +1.71%. In terms of raw returns, its annualized return of 27.65% outperforms the benchmark’s 25.77%.
When we overlay the broker disagreement factor onto Strategy 1 to filter for “cross-broker consensus,” Strategy 2 achieves a clean triumph across all three hurdles:
In summary, the empirical backtests perfectly validate our baseline factor analytics: the strategy must be built upon Large-Cap Stocks and Value Weighting, and it continues to comfortably outperform the benchmark index even after factoring in all transaction costs and liquidity limitations.
Combining the empirical evidence from this two-part factor series, we draw two key conclusions for chip-based quantitative investing in Taiwan:
The Allocation Blueprint Dictates Survival (Size-Conditionality Execution): The foreign institutional trading concentration factor (conc_qfii) possesses a strong size-conditionality. Applying a broad-market equal-weighted implementation introduces small-cap short-squeeze noise, which distorts and neutralizes the factor’s alpha. Our backtesting results demonstrate that only by anchoring the strategy within the “top 30% large-cap universe” and deploying a “value-weighted” allocation matrix can a portfolio absorb real-world transaction costs and reliably beat the market benchmark.
Multi-Factor Fusion (Concentration + Consensus) is a Crucial Quantitative Tool: While following pure foreign concentration (Strategy 1) offers steady index-enhancement features, integrating the Broker Channel Disagreement factor (Strategy 2) to select large-caps backed by cross-broker consensus provides substantial improvements. It simultaneously elevates returns (annualized Alpha of +3.88%) and mitigates downside risk (MDD contained to -26.51%). This multi-factor approach represents an actionable, highly robust quantitative strategy suitable for institutional large-cap asset allocation.
The foreign institutional trading concentration factor (conc_qfii) represents one component of chip and factor research. Built upon high-quality, long-horizon historical data with strict Point-in-Time (completely free of look-ahead bias) characteristics, the TEJ Factor Library offers a comprehensive quantitative framework encompassing Sentiment, Ownership & Chip-Flows, Momentum, Value, Quality, and Growth factors.
For quantitative researchers, portfolio managers, and institutional investors, structurally clean data with fully transparent computational logic forms the bedrock of hypothesis testing and strategy alpha generation. Whether you aim to deploy multi-factor models to optimize asset models or extract institutional smart money signals across the Taiwan market, the TEJ Factor Library serves as a reliable quantitative asset.
➡️ Discover the TEJ Factor Library immediately to elevate your quantitative investment strategies to the next horizon!
