
Table of Contents
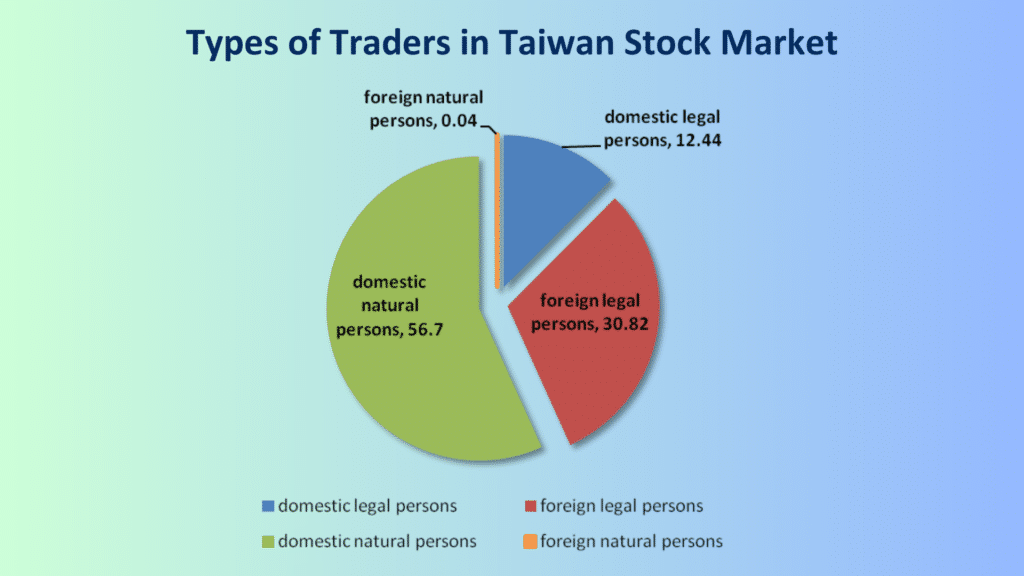
In mature markets such as Europe and America, institutional investors account for the largest proportion, and studies have shown that the trading behavior of institutional investors has predictive power for stock prices. However, as shown in the figure1 below, in the Taiwan stock market, retail investors account for the highest proportion and have the highest trading volume in the market, indicating that non-institutional investors have an important position in the Taiwan market. Therefore, this article uses the data on shareholder diversification from the Taiwan Depository & Clearing Corporation (TDCC) to study the relationship between retail investor trading behavior and stock expected returns and to evaluate the feasibility of investment strategies.
Retail investors, due to their lagging information, exhibit a negative relationship between their trading behavior and stock price trends. When they are optimistic and buy stocks, prices often fall; conversely, when they are pessimistic and sell stocks, prices often rise. Since there has been little research on using shareholder who hold 1-5 shares category as a proxy variable for retail investors, this article uses factor analysis to delve into the relationship between retail investor trading behavior and stock expected returns and examines their predictive ability for stock prices.
This study uses Taiwan stock data provided by TEJ, including stock price data, shareholder diversification data from TDCC, and stock daily trading information. To represent the entire Taiwan stock market, the sample is taken from common stocks listed on the TWSE and OTC market from January 2016 to December 2023, excluding factors such as new stocks and low-priced stocks.
Generally, retail investors, due to their lack of professional investment knowledge and lagging information, are easily influenced by short-term news factors. The shareholder diversification table is mainly grouped by shareholder ID, divided into 15 different levels based on the number of shares held (1 lot or less (1-999 shares), 1 to 5 lots, 5 to 10 lots…1000 lots or more), and discloses the number of shareholders, shares held, and shareholding ratio according to this classification.
Therefore, the method of constructing retail investor factors in this study will use short-term changes in holdings in the 1-5 lots category from the TDCC shareholder diversification data to explore the relationship between retail investor trading behavior and stock returns. The relevant retail investor factors are constructed as follows:
| Variables | Variable descriptions | Variable Formula |
|---|---|---|
| Chg_Shareholdert | Weekly change in number of shareholders | Shareholdert /Shareholdert−1 |
| Chg_Holdingsharest | Weekly change in number of shares held | Holdingsharest /Holdingsharest−1 |
| Chg_Holdingpercentt | Weekly change in shareholding ratio | Holdingpercentt /Holdingpercentt−1 |
Factor analysis begins with portfolio analysis to select the best performers among the three factors, and then use alphalens-tej to further analyze the selected retail factor. The predictive power of the factors is evaluated in terms of factor performance, information coefficients, and turnover rates.
The portfolio analysis methodology is to calculate the three retail factors according to Table 1 every Monday, and use the factors to rank the stock incrementally into 10 groups to form a portfolio by equal weighting allocation, and then re-adjust the portfolio after holding it for one week. Finally, the average returns of the Top, Bottom, and Spread Quantiles are examined to determine which retail factor is the most predictive of future stock returns.
Table 2 shows the average returns of equal-weighted portfolios from January 2016 to December 2023, sorted by the three retail factors on a weekly basis. The results show that the investment portfolios of the Bottom Quantiles for Chg_Shareholder (weekly change in number of shareholders), Chg_Holdingshares (weekly change in number of shares held), and Chg_Holdingpercent (weekly change in shareholding ratio) factors outperform the Top Quantiles.
| Chg_Shareholder | Chg_Holdingshares | Chg_Holdingpercent | |
|---|---|---|---|
| Mean Period Wise Return Top Quantiles (bps) | 3.515 | 3.635 | 2.656 |
| Mean Period Wise Return Bottom Quantiles (bps) | 7.684 | 8.001 | 8.590 |
| Mean Period Wise Spread (bps) | -4.254 | -4.476 | -6.050 |
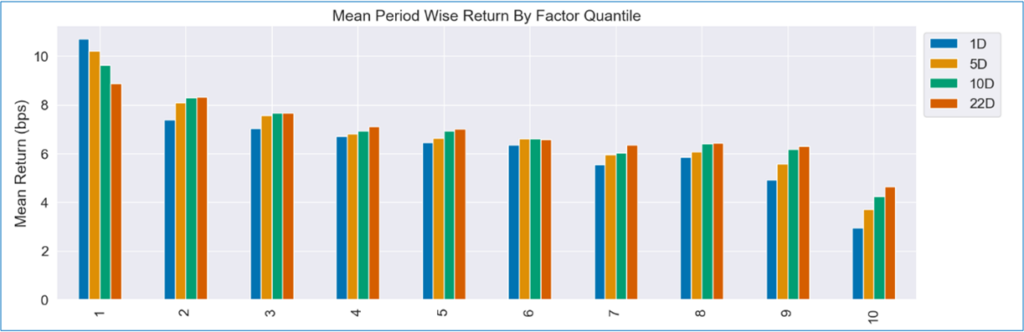
Factor performance analysis mainly uses factor ranking grouping and equal-weight allocation to establish investment portfolios, observing whether there is a monotonic relationship between average returns and rankings. The results in Figure 2 shows that investment portfolios constructed using retail investor factors have a clear monotonic decreasing relationship between average returns and rankings, whether for 1 day, 5 days, 10 days, or 22 days in the future, with the first group (Bottom Quantiles) significantly outperforming the 10th group (Top Quantiles) in terms of returns.
This not only demonstrates the negative correlation between retail investor trading behavior and stock returns but also indicates the potential to use this relationship to predict future stock returns. Create buy signals when retail investors sell a large number of stocks and sell signals when they buy a large number of stocks.
(Note: The 1st group is the Bottom Quantiles, and the 10th group is the Top Quantiles)
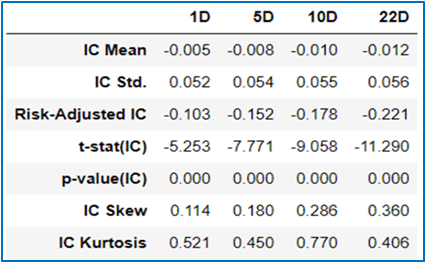
The information coefficient is the Spearman’s rank correlation coefficient between factors and future stock returns, abbreviated as IC. An IC with a value greater than 0 indicates a positive correlation between factors and future stock returns; conversely, an IC with a value less than 0 indicates a negative correlation between factors and future stock returns. The results in Table 3 show that the IC values of retail investor factors with future 1-day, 5-day, 10-day, and 22-day stock returns are all significantly negative, with IC (p-value) values of -0.005 (0.000), -0.008 (0.000), -0.010 (0.000), -0.012 (0.000).
In the previous section analyzing the predictive ability of retail investor factors, there was no consideration given to commissions, slippage, and other related trading costs. However, in actual investment scenarios, transaction fees play a critical role in determining the success of investment strategies. Therefore, this section conducts a turnover rate analysis to estimate the potential transaction fees that may arise when using retail investor factors to construct investment portfolios.
Retail investor factor data is published weekly, so the 5-day turnover rate is observed at the same frequency. As a result, the average 5-day turnover rates of investment portfolios in the Top and Bottom Quantiles are approximately 0.58 and 0.56 times, equivalent to changing the stock list twice a month. Due to the high turnover rate, frequent stock exchange transactions may result in higher handling fees and erode most profits.
To sum up, in portfolio analysis, all three retail investor factors exhibit a negative correlation with stock returns, with Chg_Holdingpercent (weekly change in shareholding ratio) showing the most predictive ability. Secondly, in the alphalens-tej analysis, the Chg_Holdingpercent factor demonstrates a monotonic decreasing relationship between group ranking and average returns under different forecast periods. Additionally, the overall factor exhibits a significantly negative correlation with future stock returns. However, a high turnover rate of investment portfolios may lead to erosion of investment returns due to more frequent swaps in actual trading. Therefore, the subsequent sections of this article will further conduct simulation backtesting, considering actual commissions, slippage, liquidity, and other trading restrictions, to evaluate the performance of investment portfolios.
Start Building Portfolios That Outperform the Market!
Using Chg_Holdingpercent as an indicator, the top 10% of stocks with the highest selling volume among retail investors are selected to construct an investment portfolio. As the figures below, the weekly frequency investment portfolio performs lower than the market, while the monthly frequency portfolio slightly outperforms the market. Considering transaction costs, liquidity, and risk restrictions, the high turnover rate affects the performance of the weekly frequency portfolio, we suggest to use monthly frequency portfolio to further analyze the returns.
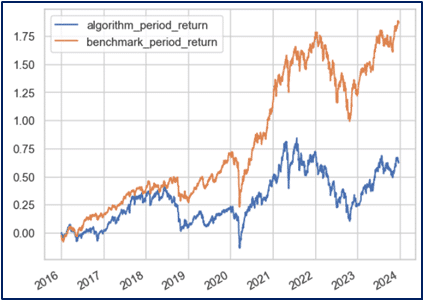
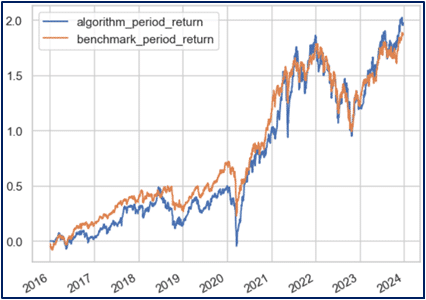
As shown in Figure 5, the performance of the portfolio continues to rise over, even after the impact of the 2018 and 2022 interest rate rising cycles. This suggests that although the portfolio’s short-term performance will be affected by the external general economic environment, it will continue to deliver good performance as the boom cycle progresses and the negative factors fade away.
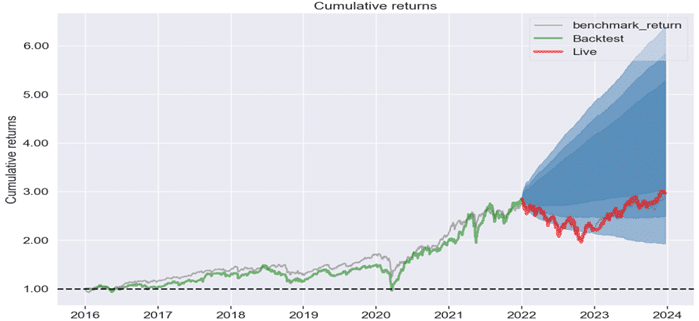
Performance analysis observes cumulative returns, with both weekly and monthly frequency portfolios showing a continuous upward trend. However, it’s crucial to note that during interest rate hikes, there may be a long-term drawdown period. Risk analysis indicates that the maximum drawdown can reach 25-35%, and portfolios with long positions may be affected during pullbacks. It is recommended to combine other effective factors in stock selection indicators to avoid reduced profits due to high turnover rates.
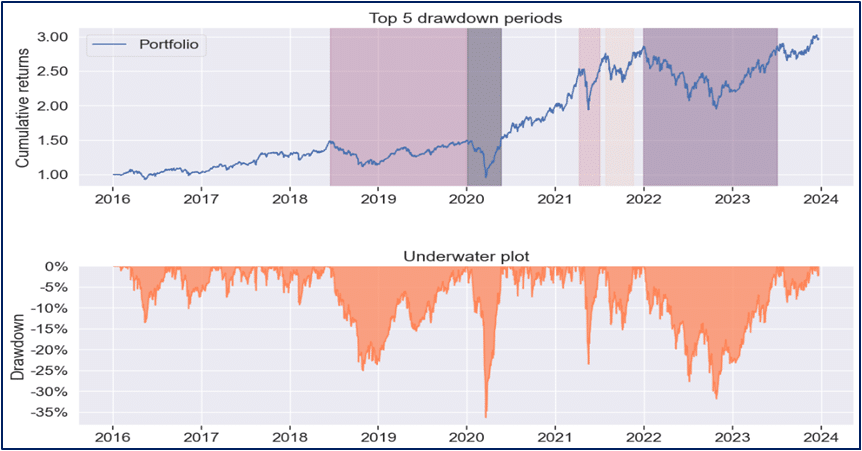
In summary, the analysis results show that when using weekly change in retail investors shareholding ratio as a factor to construct investment portfolios, and considering transaction fees, liquidity, as well as trading risk restrictions, weekly frequency investment portfolio underperforms due to the high turnover rate. On the other hand, the performance of the monthly frequency investment portfolio is comparable to the market index. Further analysis indicates that after experiencing two interest rate rising cycles, the cumulative returns of the investment portfolio continue to rise. However, it’s important to note that during interest rate hikes, the investment portfolio may experience a drawdown period lasting up to one and a half years, with a drawdown exceeding 25%.
This study explores the relationship between retail investor trading behavior and stock expected returns based on nearly 8 years of listed stock data. Retail investor factors were constructed using changes in the number of shareholders, number of shares held, and shareholding ratio in the 1-5 lots category. We further use factor analysis, simulation backtesting, and performance analysis to examine the result. Based on the comprehensive analysis, the following three conclusions are drawn:
“Taiwan stock market data, TEJ collect it all.”
The characteristics of the Taiwan stock market differ from those of other European and American markets, and the dynamics of retail investors are worth noting. Especially in the first quarter of 2024, with the Taiwan Stock Exchange reaching a new high of 20,000 points due to the rise in TSMC’s stock price, global institutional investors are paying more attention to the performance of the Taiwan stock market.
Taiwan Economical Journal (TEJ), a financial database established in Taiwan for over 30 years, serves local financial institutions and academic institutions, and has long-term cooperation with internationally renowned data providers, providing high-quality financial data for five financial markets in Asia.
With TEJ’s assistance, you can access relevant information about major stock markets in Asia, such as securities market, financials data, enterprise operations, board of directors, sustainability data, etc., providing investors with timely and high-quality content. Additionally, TEJ offers advisory services to help solve problems in theoretical practice and financial management!
