Table of Contents
Using the Moving Average and standard deviation to construct a Bollinger Band, determine when to buy and sell.
Bollinger Band is a technical indicator that John Bollinger invents in the 1980s. Bollinger Bands consist of the concepts of statistics and moving averages. The moving Average(MA) is the average closing price of a past period. Normally the period of MA in Bollinger Band is 20 days, and Standard Deviation(SD) is usually represented by σ in mathematical sign, which is used to evaluate the data’s degree of discrete.
Bollinger Band is composed of three tracks:
● The upper track:20 MA+double standard deviation
● The middle track:20 MA
● The lower track:20 MA+double standard deviation
During the long-term observation period, the investment target price distribution will be Normal Distribution. According to statistics, there is a 95% of probability that the price will present between μ − 2σ and μ + 2σ, which is also called a 95% Confidence Interval(CI). Bollinger Band is the technical indicator base on the theories above.
When the closed price touches the upper track, we consider it a signal of price fall, and then we will sell our holding position at tomorrow’s open price.
When the closed price touch the lower track, we consider it to be a signal of price rise, and then we’re going to buy 1 unit at tomorrow’s opened price; when the conditions above are already satisfied, we remain adequate principal, both the holding position and the closed price are lower than last time buying price, we will buy one more unit.
This article uses Mac OS as a system and jupyter as an editor.
For the period from 2021–06–01 to 2022–12–31, we take AUO Corporation(2409) as an example, we will use unadjusted closed price、BB-Upper(20)、BB-Lower(20) to construct the Bollinger Band, and then we will compare the return with Market Return Index(Y9997)
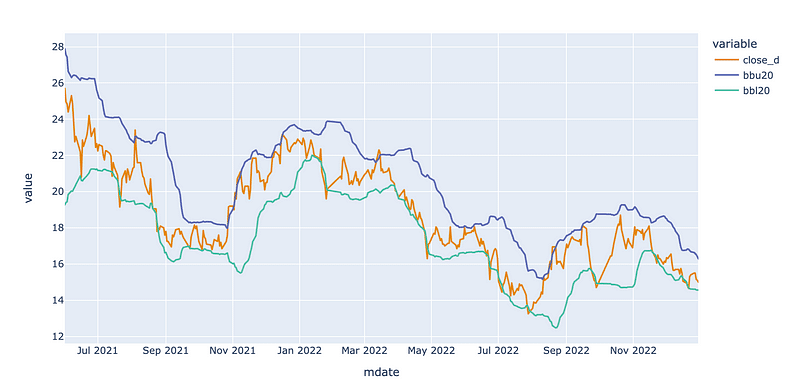
After acquiring the investment target price and technical indicator data, let’s draw the Bollinger Band first. Here we use Plotly. express to draw the line chart. In the diagram, bbu20 will be the upper track 、bbl20 will be the lower track, and close_d will be the closed price.
We define some parameters here.
● principal: the total amount of funds invested by investors. In this study, we invest 500000 dollars.
● position: the number of units investors held.
● cash: the amount of funds investors held after each trade.
● order_unit: each trade’s amount of share unit
Next, we start building our trading strategy based on these parameter, such as position, cashm and order_unit. We set our principal amount and decide the timing of market entry and exit conditions.
principal = 500000
cash = principal
position = 0
order_unit = 0
trade_book = pd.DataFrame()

for i in range(data.shape[0] -2):

    cu_time = data.index[i]
    cu_close = data.loc[cu_time, 'close_d']
    cu_bbl, cu_bbu = data.loc[cu_time, 'bbl20'], data.loc[cu_time, 'bbu20']
    n_time = data.index[i + 1]
    n_open = data['open_d'][i + 1]


    if position == 0: #entry condition
        if cu_close <= cu_bbl and cash >= n_open*1000:
            position += 1
            order_time = n_time
            order_price = n_open
            order_unit = 1
            friction_cost = (20 if order_price*1000*0.001425 < 20 else order_price*1000*0.001425)
            total_cost = -1 * order_price * 1000 - friction_cost
            cash += total_cost
            trade_book = trade_book.append(
                pd.Series(
                [
                    stock_id, 'Buy', order_time, 0, total_cost, order_unit, position, cash
                ]), ignore_index = True)

    elif position > 0:
        if cu_close >= cu_bbu: # exit condition
            order_unit = position
            position = 0
            cover_time = n_time
            cover_price = n_open
            friction_cost = (20 if cover_price*order_unit*1000*0.001425 < 20 else cover_price*order_unit*1000*0.001425) + cover_price*order_unit*1000*0.003
            total_cost = cover_price*order_unit*1000-friction_cost
            cash += total_cost
            trade_book = trade_book.append(pd.Series([
                stock_id, 'Sell', 0, cover_time, total_cost, -1*order_unit, position, cash
            ]), ignore_index=True)

trade_book.columns = ['Coid', 'BuyOrSell', 'BuyTime', 'SellTime', 'CashFlow','TradeUnit', 'HoldingPosition', 'CashValue']
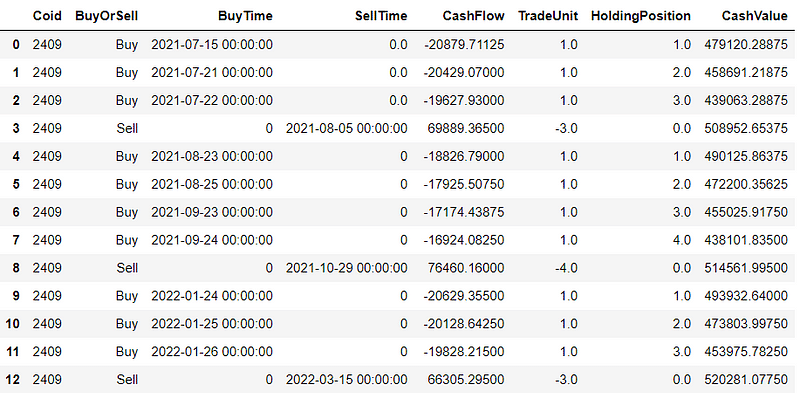
Let’s review our transaction record after executing above trading strategy code. You can find the source code about how to make this transaction record table at the bottom of the article.
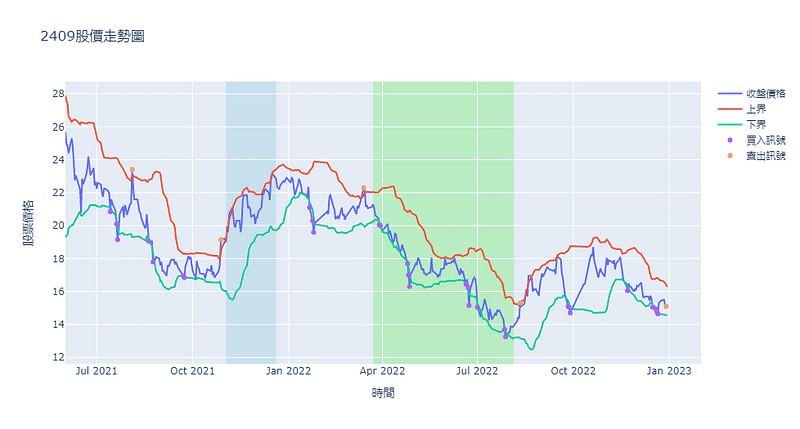
By observing the following graph, we can find out that there is a rising trend from 2021/11 to 2021/12(the light blue area) because the closed price can’t touch the lower track of the Bollinger band; no action of buying. The result is that we can not earn any profit from this upward trend.
The same issue also appears in the continuous falling downward trend, like the interval starting from 2022/04(light green area), repeatedly touching the lower track of the Bollinger band and then back up slightly. Because the upper track of the Bollinger band is too low, which means easy to touch, the holding position will be sold sooner, leading to a negative return in this interval.
In fact, because of the hysteresis of the 20MA Bollinger band, a short-term fluctuation in price can not be reflected by the 20MA Bollinger band.
We suggest shortening the term of the MA or use with other technical indicators which observe the trend of the investment target if the target stock you are analyzing has a higher rate of fluctuation.
Then, we can examine the performance of these trading strategies and calculate the returns of the market, average transactions, trading gains and losses, etc.
There have been only 29 transactions in one and a half years. The way to increase the number of transactions is to improve the strategy by following the suggestions we mentioned before.
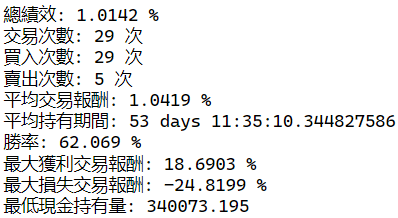
Furthermore, we visualize the performance and accumulated returns of these trading strategies to better compare the distinct between the “buy and hold” strategy, trading strategy, and market index.
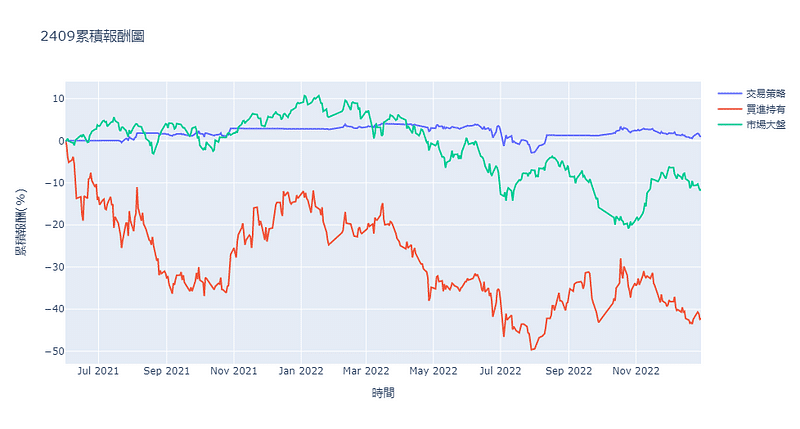
From the second half of 2021 to the end of 2022, the trend of AUO Corporation(2409) is going down. If taking the “buy and hold” strategy,
Eventually, the accumulated return will be terrible, about -40% to -50%.
On the other hand, if we choose the Bollinger band strategy, the performance will be better than “buy and hold.” Besides, although AUO Corporation’s (2409) price trend is worse than the market average price trend during the observation period, the return performance of the Bollinger band strategy beats the Market.
However, this is the simplest Bollinger band strategy. We can find out that during the price recovery interval, which is just after the vast falling period, we will face the predicament of selling stock too early; Further, during the upward trend, there is prone to encounter the other predicament of seldom buying.
In light of the above predicaments, combining the strategy with other price-trend-detecting indicators is recommended for a considerable fluctuation investment target to optimize the strategy.
Last but not least, please note that “Stocks this article mentions are just for the discussion, please do not consider it to be any recommendations or suggestions for investment or products.” Hence, if you are interested in issues like Creating Trading Strategy , Performance Backtesting , Evidence-based research , welcome to purchase the plans offered in TEJ E Shop and use the well-complete database to create your own optimal trading strategy.