
Table of Contents
In investment practice, industry rotation has long been a key basis for capital allocation and stock selection. As the economic cycle progresses, market capital often shifts gradually from leading industries to lagging ones, forming a structural sector rotation. For instance, during the early stage of economic recovery, cyclical sectors such as shipping and steel often react first. As the economy continues to expand and corporate capital expenditures increase, growth-oriented sectors like semiconductors and technology stocks may take the lead.
Although this type of rotation logic is widely referenced in macroeconomic analysis, accurately identifying its starting and ending points still requires the support of quantitative tools and empirical data. This article focuses on historical data from various industry indices and utilizes statistical tools such as Transfer Entropy and rolling correlation coefficients to examine whether stable lead-lag relationships exist between different sectors. It also explores the potential role of economic indicators, such as the business cycle signal lights, in these inter-sector dynamics.
Taiwan’s economic structure is heavily reliant on technology manufacturing and export-oriented industries, with the semiconductor sector at its core. According to data from the Ministry of Economic Affairs, Taiwan holds a leading global market share in semiconductors, encompassing a complete supply chain from upstream IC design, to midstream wafer fabrication, and downstream packaging and testing. The semiconductor industry serves as a major driver of Taiwan’s GDP and exports, making its business cycle and capital flows a key indicator not only for the domestic stock market but also for the broader economy.
However, across different phases of the economic cycle, market capital does not always concentrate in a single sector. Instead, it rotates among various segments depending on prevailing macroeconomic conditions. This rotation may be influenced by multiple factors, such as fluctuations in global trade, inflationary pressure, interest rate policies, and capital expenditure cycles. Therefore, understanding the relative dynamics between the semiconductor sector and other industries can help investors make more forward-looking decisions in sector allocation.
In light of this, the semiconductor industry is selected as the core observation target in this study. We further examine whether it exhibits clear lead-lag or rotational relationships with other sectors—such as finance and insurance, shipping, and biotechnology—and attempt to construct a practical framework for predicting sector rotation.
For the purpose of conducting empirical analysis on industry rotation, this study utilizes historical industry index data provided by TEJ Quantitative Investment Database. The database covers major sector classifications in Taiwan stock market, including semiconductors, electronics, finance & insurance, shipping, and biotechnology. It offers long-term, daily historical data, making it well-suited for analyzing rotation behavior over time.
👉 Start your Quantitative Strategy from TEJ Quantitative Investment Database
Since industry indices are price-based and typically show a gradual upward trend over the long run, they do not fluctuate within a fixed range. As a result, directly analyzing raw price data makes it difficult to detect relative strength changes across sectors. To address this issue, the study applies the Relative Strength Index (RSI) to each industry index. RSI, a momentum-based indicator, reflects the proportion of gains versus losses over a given time window, allowing us to identify periods of relative strength or weakness among sectors.
After computing the RSI time series for each sector, the following three analyses are performed:
Through these methods, the study aims to quantify and verify whether time-shifted rotational logic exists among industries, thereby providing practical insights for investment strategy decisions. The analysis uses data from early 2012 to the end of 2019 for model development, while the period from early 2020 onward is reserved for strategy backtesting to avoid overfitting.
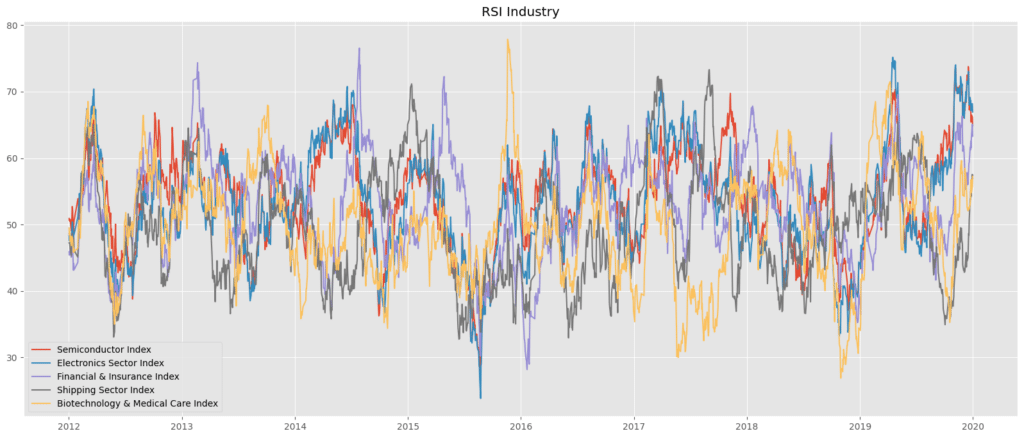
Visual analysis of RSI trends suggests the presence of rotational behavior among sectors, with some leading or lagging at different phases. The RSI, as a momentum indicator, highlights relative strength shifts across industries over time. However, visual patterns alone are insufficient to confirm statistical validity. To address this, we apply quantitative techniques in the following sections to verify whether these observed dynamics reflect consistent, data-driven relationships.
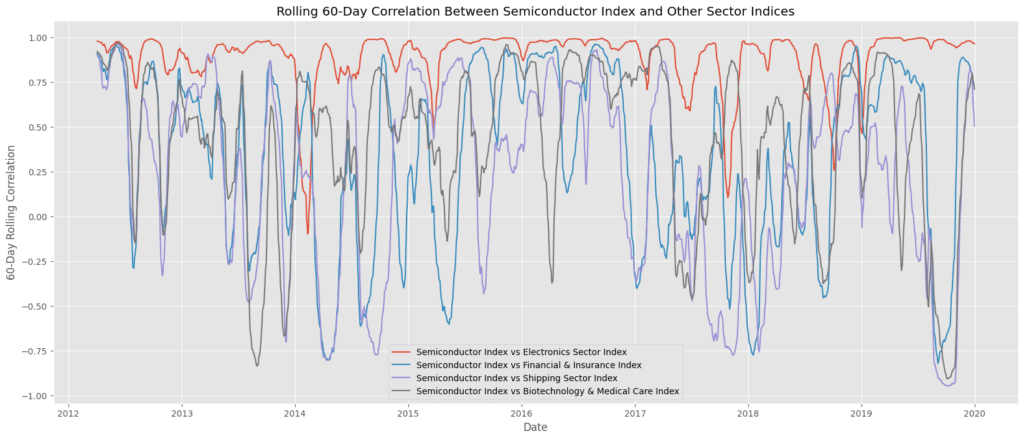
The 60-day rolling correlation chart captures how industry RSI values co-move with the semiconductor sector over time. Electronics show persistently high correlation with semiconductors, suggesting a structurally aligned trend. In contrast, the shipping sector exhibits cyclical swings in correlation, indicating a potential lagged relationship. Financials and biotechnology display more volatile or inverse patterns, implying weaker alignment. These findings support the hypothesis that certain industries, particularly shipping, may demonstrate rotational behavior relative to semiconductors—offering practical signals for sector allocation strategies.
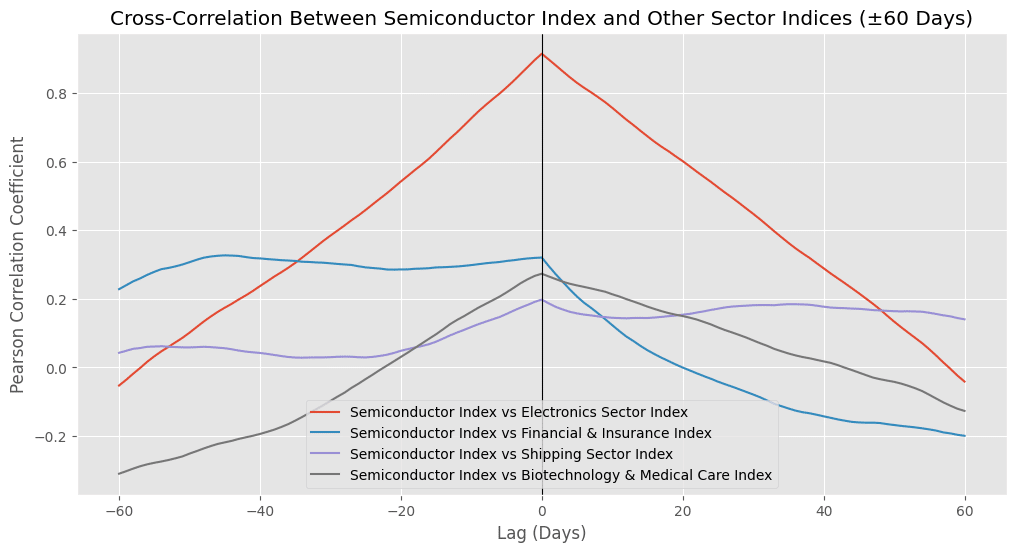
This section explores lagged correlations between each sector and the semiconductor index over a ±60-day window. The shipping sector shows the strongest correlation at +30 days, suggesting it may lead semiconductors by about one month. In contrast, financials peak at -50 days, implying they tend to lag behind semiconductors. Electronics and biotech exhibit flatter correlation curves, lacking clear lead-lag structure.
These results support the hypothesis of a “Shipping → Semiconductors” rotation sequence, while the reverse holds for finance—offering insight into potential timing windows for inter-sector allocation.
Transfer Entropy (TE) quantifies the directional strength of information flow between two time series, capturing asymmetric and nonlinear relationships that traditional correlation may overlook. In simple terms, if the TE from Industry A to Industry B is consistently greater than the reverse, it suggests that changes in A offer stronger predictive value for B.
The tables below summarize TE values across different lag settings (3, 5, and 7 trading days) between the semiconductor sector and other key industries. Importantly, only when a consistent directional flow is observed across multiple lags do we consider the result statistically reliable and indicative of a meaningful sector rotation pattern.
Shipping Sector vs. Semiconductor Sector
| Lag Period (Trading Days) | TE: Shipping → Semiconductor | TE: Semiconductor → Shipping | Information Flow Direction |
| 3 | 0.0177 | 0.0155 | Shipping → Semiconductor |
| 5 | 0.0539 | 0.0376 | Shipping → Semiconductor |
| 7 | 0.0866 | 0.0589 | Shipping → Semiconductor |
TE values from shipping to semiconductors are consistently higher across all lags and increase with longer lag periods. This suggests strong directional stability and positions shipping as a potential leading indicator.
Finance and Insurance Sector vs. Semiconductor Sector
| Lag Period | TE: Finance → Semiconductor | TE: Semiconductor → Finance | Information Flow Direction |
| 3 | 0.0188 | 0.0164 | Finance → Semiconductor |
| 5 | 0.0469 | 0.0538 | Semiconductor → Finance |
| 7 | 0.078 | 0.0811 | Semiconductor → Finance |
The direction of information flow varies across lags. While finance appears to lead at shorter lags, semiconductors lead at longer ones. This inconsistency reduces its predictive reliability.
Biotechnology Sector vs. Semiconductor Sector
| Lag Period | TE: Biotech → Semiconductor | TE: Semiconductor → Finance | Information Flow Direction |
| 3 | 0.0139 | 0.0169 | Semiconductor → Biotech |
| 5 | 0.0487 | 0.0333 | Biotech → Semiconductor |
| 7 | 0.0779 | 0.0494 | Biotech → Semiconductor |
Biotech shows a similarly unstable relationship. The flow direction reverses depending on the lag setting, indicating weak and inconsistent influence.
These results suggest that the shipping sector may serve as a robust input for rotation-based models, while finance and biotech are more prone to instability and parameter sensitivity.
Disclaimer: This analysis is for informational purposes only and does not constitute any investment advice or recommendation on specific financial products.
This study presents empirical evidence that Taiwan’s shipping sector can serve as a leading indicator for semiconductor performance, supported by consistent signals from rolling correlation, lagged correlation, and Transfer Entropy analyses. These findings offer a quantitative foundation for developing timing strategies and inter-sector rotation models within Taiwan stock market.
For investors seeking to build such strategies, TEJ provides comprehensive Point-in-time databases tailored for quantitative research. These resources include historical sector indices, industry-level classifications, and both market and fundamental data—critical for accurately distinguishing sector behavior and analyzing stock performance over time.
