
Table of Contents
Trading in the financial markets is a complex task, and even professional investors often find it challenging to outperform the market consistently. In Taiwan’s equity market, investors often face the dilemma of whether to ride rising trends or avoid purchasing at peak prices.
This article presents a structured momentum strategy designed to identify and capture stocks with strong upward trends. Through detailed backtesting, we evaluate the strategy’s performance, providing a valuable reference for quantitative researchers and practitioners.
In the stock selection process, we aim to avoid securities with low trading volume that are prone to sharp price fluctuations due to manipulation by large investors or institutional players. To mitigate such risks, we construct our stock universe by selecting the top 200 companies by market capitalization each year, ensuring that the chosen stocks possess high liquidity and sufficient market depth..
After establishing the stock universe, we evaluate each individual stock by calculating its closing prices over the past month—a period that can be adjusted based on specific needs—to assess its medium- to long-term momentum. From this analysis, we select the top five stocks exhibiting the strongest momentum. This stock selection strategy helps capture prevailing trends among market leaders.
On the first trading day of each month, we buy the top five momentum stocks identified from the previous period and sell those held in the prior portfolio that no longer meet the selection criteria. If a stock remains in the top five for two consecutive periods, it continues to be held without being sold. Each of the five positions is rebalanced using order_target_percent to allocate 20% of the portfolio’s value to each stock.
The strategy is designed to simulate an investment approach that does not require constant monitoring and is unaffected by intraday price volatility. Momentum rankings are calculated at the end of each month, and trades are executed one minute before the close on the first trading day of the following month. To reflect the real-world costs of trading, the strategy incorporates a slippage function to simulate price friction when placing orders. This approach is both simple and effective, making it suitable for investors who prefer a low-maintenance strategy.
# 載入常用套件
import numpy as np
import pandas as pd
import matplotlib.pyplot as plt
)
import tejapi
import os
os.environ['TEJAPI_BASE'] = 'https://api.tej.com.tw'
os.environ['TEJAPI_KEY'] = 'your_key'


from zipline.sources.TEJ_Api_Data import get_universe
from zipline.data import bundles
from zipline.sources.TEJ_Api_Data import get_Benchmark_Return
from zipline.pipeline.mixins import SingleInputMixin
from zipline.pipeline.data import TWEquityPricing
from zipline.pipeline.factors import CustomFactor
from zipline.pipeline import Pipeline
from zipline.TQresearch.tej_pipeline import run_pipeline
from zipline import run_algorithm
pool = get_universe(start = '2018-01-01',
                    end = '2025-04-10',
                    mkt_bd_e = ['TSE'],
                    stktp_e = 'Common Stock'
)

start = '2018-06-01'
end = '2025-04-10'


os.environ['mdate'] = start + ' ' + end
os.environ['ticker'] = ' '.join(pool) + ' ' + 'IR0001'

!zipline ingest -b tquantWith price and volume data in place, we can use the CustomFactor function to construct our desired momentum indicator. This function calculates the momentum of each stock by analyzing the change in closing prices over a specified time window (window_length) for each individual security.
from zipline.pipeline.filters import StaticAssets

class Momentum(CustomFactor):
    inputs = [TWEquityPricing.close]

    window_length = 20

    def compute(self, today, assets, out, close):

        return_rate = (((close[-1] - close[0]) / close[0]) * 100).round(5)
        out[:] = return_rate
In this code snippet, Momentum() inherits from CustomFactor and defines the logic for calculating momentum. The window_length parameter specifies the length of the lookback period (e.g., 20 days), and momentum is computed based on the change between the first and last closing prices within that period. This approach enables us to easily calculate the momentum of each stock over a defined time frame.
The Pipeline() function offers users an efficient way to process quantitative indicators and price-volume data across multiple securities. In this case, we use it to:
CustomFactor function for momentum calculationThis setup streamlines the data preparation process, enabling scalable and systematic analysis across a broad universe of stocks.
start = '2019-01-01'
end = '2025-04-10'
start_dt, end_dt = pd.Timestamp(start, tz='utc'), pd.Timestamp(end, tz='utc')
bundle = bundles.load('tquant')
benchmark_asset = bundle.asset_finder.lookup_symbol('IR0001', as_of_date=None)

def make_pipeline():

    mom = Momentum()

    curr_price = TWEquityPricing.close.latest

    return Pipeline(
        columns={
            'curr_price': curr_price,
            'Momentum': mom
        },

        screen=~StaticAssets([benchmark_asset])
    )

my_pipeline = run_pipeline(make_pipeline(), start_dt, end_dt)
dates = my_pipeline.index.get_level_values(0).unique()
my_pipeline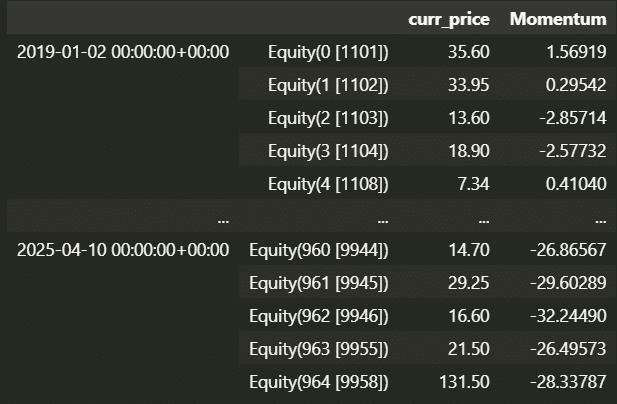
The initialize() function is used to define the daily trading environment before the start of the backtest. In this example, we configure the following:
Pipeline for momentum calculation into the trading algorithmcontext.last_rebalance_day to record the date of the last portfolio rebalanceThis setup ensures that the trading strategy operates under realistic market conditions and dynamically updates its universe and portfolio allocations based on well-defined criteria.
from zipline.finance import slippage, commission
from zipline.api import *
from zipline.api import set_slippage, set_commission, set_benchmark, attach_pipeline, order, order_target, symbol, pipeline_output, record
def initialize(context):
    context.holding_stock    = False
    context.target           = None
    context.targets = []
    context.last_rebalance_day = None

    context.stock_buy_price  = 0
    context.rebalance_period    = 20


    set_slippage(slippage.FixedBasisPointsSlippage(basis_points=50.0, volume_limit=1))
    set_commission(commission.PerShare(cost=0.001425 + 0.003/2))
    attach_pipeline(make_pipeline(), 'mystrats')
    set_benchmark(symbol('IR0001'))


    context.top200_by_year = {}
    for Y in years:

        sessions = calendar.sessions_in_range(
            pd.Timestamp(f"{Y-1}-01-01", tz=tz),
            pd.Timestamp(f"{Y-1}-12-31", tz=tz),
        )
        last_session = sessions[-1]

        dt_str = last_session.strftime('%Y-%m-%d')
        cap = TejToolAPI.get_history_data(
            start   = dt_str,
            end     = dt_str,
            ticker  = pool,
            columns = ['Market_Cap_Dollars']
        )
        #print(f"Year: {Y}, Date: {dt_str}")
        coids = (
            cap.sort_values('Market_Cap_Dollars', ascending=False)
               .head(200)['coid']
               .tolist()
        )

context.top200_by_year[Y] = [symbol(c) for c in coids]The handle_data() function plays a crucial role in constructing the trading strategy, as it is called on each trading day during the backtest. Its primary responsibilities include defining the trading logic, executing orders, and recording trade-related information.
As mentioned at the beginning of the article, this strategy only requires checking whether the current date marks the beginning or end of the month, and making buy or sell decisions based on the momentum rankings at that time.
Strategy Summary:
def handle_data(context, data):

    out_dir = pipeline_output('mystrats')
    current = context.get_datetime().normalize()
    y, m, d = current.year, current.month, current.day


    mdays     = dates[(dates.year == y) & (dates.month == m)]
    first_day = mdays.min().day


    if d == first_day:

        universe = context.top200_by_year.get(y, [])

        today_df = out_dir.loc[out_dir.index.isin(universe)]
        if today_df.empty:
            return


        top5 = today_df['Momentum'].nlargest(5).index.tolist()


        prev    = context.targets
        to_drop = set(prev) - set(top5)
        for asset in to_drop:
            order_target_percent(asset, 0)
            print(f"Drop {asset}")


        weight = 1.0 / len(top5)
        for asset in top5:
            order_target_percent(asset, weight)
            print(f"Rebalance {asset} to {weight:.0%}")


        context.targets = top5

def analyze(context, perf):
    pass
If you wish to customize the rebalancing frequency, you can replace the original handle_data() function with the version below. Additionally, modify context.rebalance_period in the initialize() function to specify the desired number of days between each rebalance.
def handle_data(context, data):

    out_dir = pipeline_output('mystrats')
    current = context.get_datetime().normalize()


    if context.last_rebalance_day is None:
        context.last_rebalance_day = current


    days_since = (current - context.last_rebalance_day).days
    if days_since < context.rebalance_period:
        return

    context.last_rebalance_day = current

    y        = current.year
    universe = context.top200_by_year.get(y, [])
    #  直接用單層 index 篩選
    today_df = out_dir.loc[out_dir.index.isin(universe)]
    if today_df.empty:
        return

    top5 = today_df['Momentum'].nlargest(5).index.tolist()

    prev    = context.targets
    to_drop = set(prev) - set(top5)
    for asset in to_drop:
        order_target_percent(asset, 0)
        print(f"Drop {asset}")

    weight = 1.0 / len(top5)
    for asset in top5:
        order_target_percent(asset, weight)
        print(f"Rebalance {asset} to {weight:.0%}")

    context.targets = top5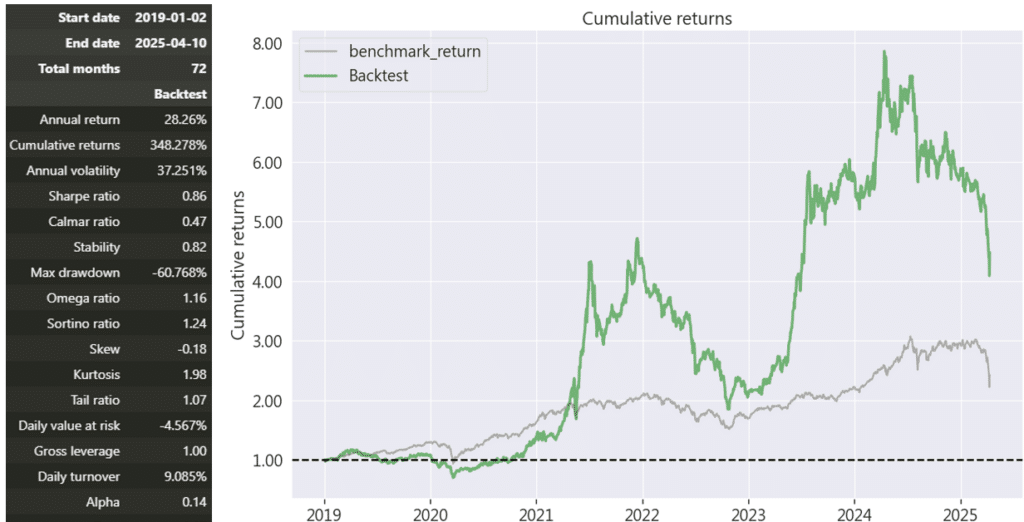
Below is a summary of the core backtest logic:
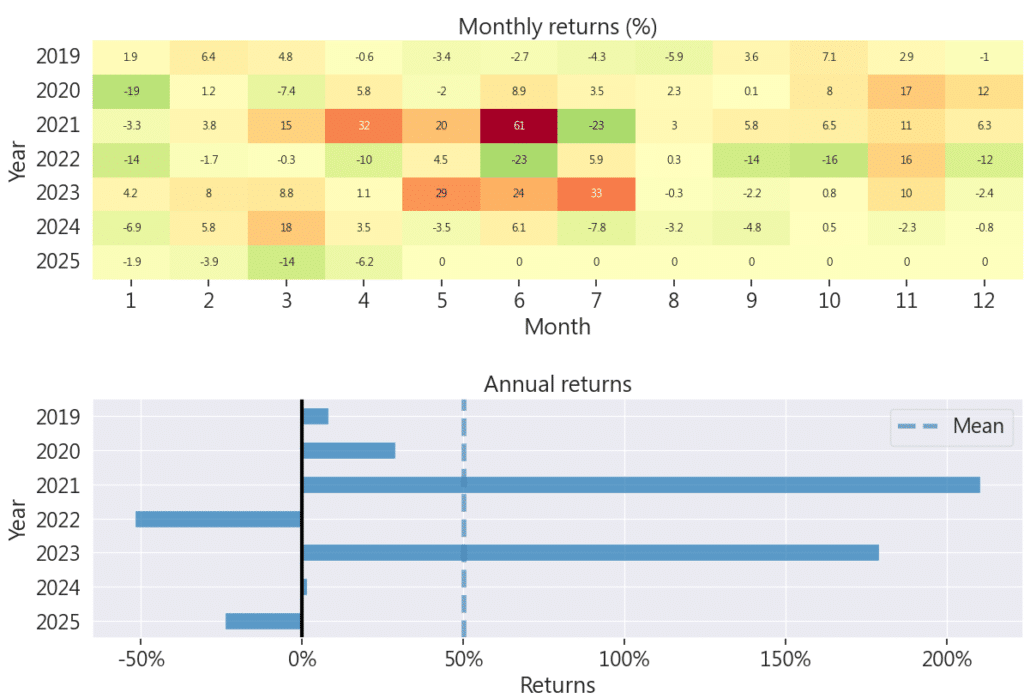
Performance Overview
Although the strategy presents significant profit potential, it also entails considerable risk. The strategy successfully captured major opportunities, such as the 2021 rally in Yang Ming Marine Transport, which contributed substantially to the overall performance.
This strategy presents a fascinating question: should you “get on board”? Readers likely have their own answers to this. Even though the stock universe has been limited to the top 200 companies by market capitalization—an effort to reduce the risk of price manipulation—the stocks selected as the top five momentum performers are often those that have experienced sharp gains in the recent past. Such stocks may be nearing the end of their rally, or they may continue to ride their upward momentum.
The key to achieving significant profits with this strategy lies in taking on higher risk while successfully capturing stocks with strong upward momentum. For instance, in 2021, the strategy benefited from the explosive rally of Yang Ming Marine Transport Corporation. In 2024, despite a drawdown of over 10%, the stock rebounded strongly, yielding considerable returns. However, during the tariff war of 2025, its performance lagged the broader market, highlighting the inherent volatility of such trades.
For readers interested in further exploration, the strategy can be customized to reflect different market conditions. By adjusting the code to include stop-loss and take-profit mechanisms, you can test how such modifications affect performance. The core logic of the strategy is already in place—what remains is the flexibility to adapt it to suit various investment scenarios and validate its robustness under different conditions.
“Taiwan stock market data, TEJ collect it all.”
For researchers and investors looking to refine their trading strategies, access to high-quality data is paramount. TEJ’s comprehensive databases provide essential insights and historical performance data, facilitating the development and backtesting of such quantitative strategies. By leveraging these resources, users can better navigate the complexities of market dynamics and optimize their trading decisions.
