
Table of Contents
The Maintenance Margin Ratio (MMR) is an important indicator used in financial markets to assess the risk conditions of margin accounts and to determine whether investors are approaching the threshold for a broker’s margin call. When investors conduct margin trading, brokers typically set a specific MMR as the standard for issuing margin calls. The purpose is to reduce the risk of investors being unable to repay their loans during periods of high market volatility. As stock prices decline, the MMR decreases accordingly. Generally, an MMR between 130% and 160% is considered relatively safe; if it drops below 130%, brokers will usually give investors T+2 days to replenish their margin, provide additional collateral, or reduce their margin positions. Otherwise, the broker has the right to forcibly liquidate the investor’s holdings. In practice, however, MMRs often fall to 80%–90% or even lower, mainly because margin investors are mostly retail traders who tend to buy at market highs and fail to replenish margin in time when stock prices fall sharply, leading to systemic selling pressure. It is worth noting that the MMR provided by TEJ is calculated based on all margin accounts for each stock, reflecting the overall average risk exposure of the market.
Margin Multiplier:
If an investor buys one lot (1,000 shares) of a stock at NT$100 per share with a 60% margin financing ratio, then:
Initial Maintenance Margin Ratio:
= 100 / (100 × 60%) = 166%
When the stock price drops to NT$78:
Maintenance Margin Ratio:
= 78 / (100 × 60%) = 130%
When the stock price further declines to NT$60:
Maintenance Margin Ratio:
= 60 / (100 × 60%) = 100%
At this point, if the investor does not deposit additional margin, the position is considered high-risk and may be subject to forced liquidation by the broker.
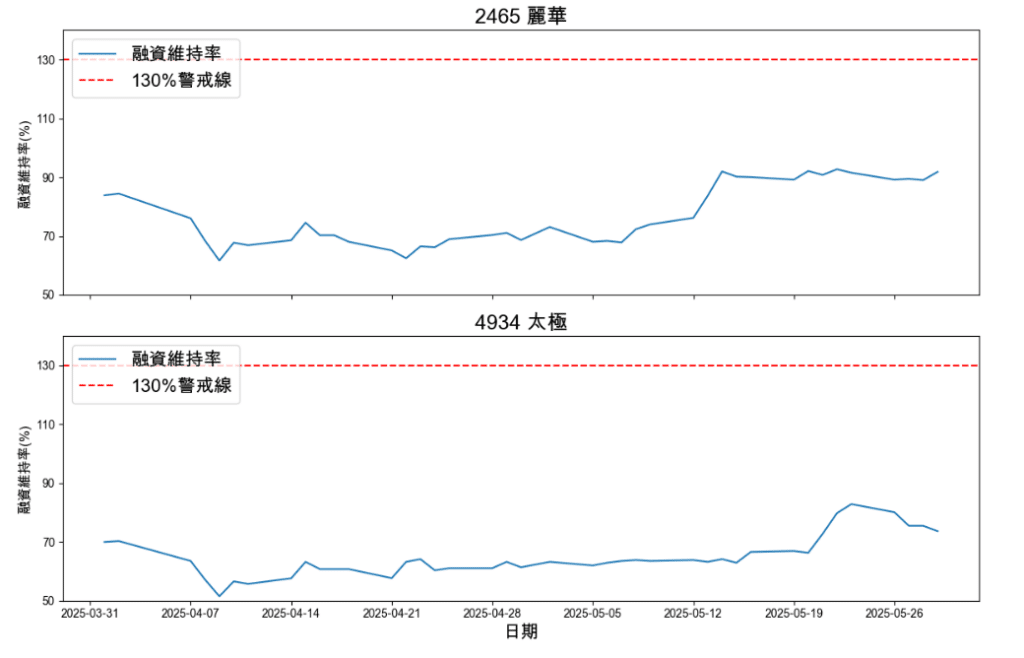
Below are examples of stocks with low maintenance margin ratios in the actual market:
High-level margin buying: Retail investors often chase stocks at their highs, leading to an overall higher average financing cost.
Sharp price declines: When sectors such as AI, shipping, or heavy electrical equipment undergo corrections, account values drop rapidly.
Failure to meet margin calls in time: Some investors choose to wait and see or are unable to deposit additional margin when required.
Market panic: Triggers a chain reaction of forced liquidation, worsening both margin balances and maintenance ratios.
In early April 2025, the Taiwan stock market experienced a major shock, plunging by 2,065 points in a single day — a drop of 9.6%, marking the third-largest single-day decline in Taiwan’s market history. Market panic surged sharply. According to Anue Juheng, the average market Maintenance Margin Ratio (MMR) fell to 133.8%, with 589 stocksdropping below the critical 130% threshold, triggering a wave of margin calls across the market. Brokers began issuing widespread margin replenishment notices. This incident illustrates that when the MMR level drops broadly, the market faces heightened systemic liquidation pressure, leading to further price declines and a vicious downward cycle. Moreover, margin balances did not decrease significantly in the short term, indicating that many investors continued to hold positions rather than cutting losses — prolonging the correction phase.
For example, in the popular AI sector:
Even though some of these stocks later rebounded briefly, their performance remained weaker than the overall market due to messy shareholder structures and unresolved loss positions. These cases demonstrate that the Maintenance Margin Ratio is a crucial indicator for identifying hidden market risks.
Beyond serving as a risk metric for margin accounts, the MMR can also function as a signal for stock selection and hedging strategies. This study constructs and backtests the following strategy:
1. Objective:
To examine whether individual stocks with abnormally low TEJ Maintenance Margin Ratios exhibit statistically significant short-term mean-reversion behavior, and to evaluate whether combining MMR with technical and sentiment filters can enhance strategy performance.
2. Entry Conditions:
3. Trading and Risk Control Rules:
Once all entry conditions are met, buy at the opening price on the same “red candle” day.
Hold for 15 trading days or until either a stop-loss or take-profit is triggered:
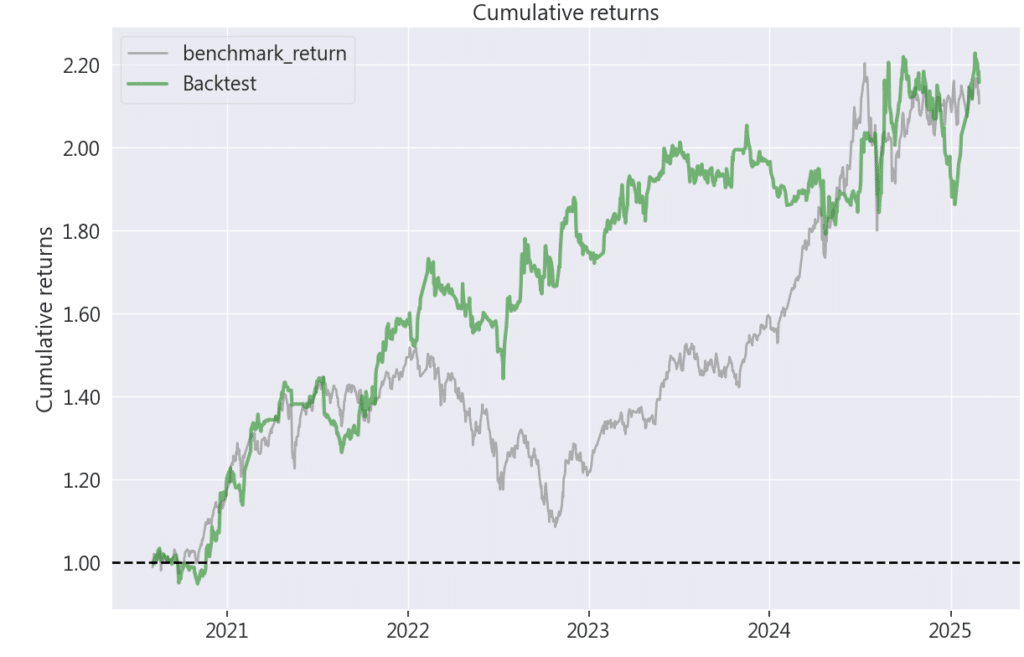
4. Backtesting and Performance Evaluation:
| Performance Metrics / Strategy | Benchmark | Maintenance Margin Ratio Investment Strategy |
| Annualized Return | 18.39% | 19.04% |
| Cumulative Return | 110.51% | 115.6% |
| Annualized Volatility | 17.67% | 16.897% |
| Sharpe Ratio | 1.04 | 1.12 |
| Calmar Ratio | 0.65 | 1.14 |
| Maximum Drawdown | –28.47% | -16.68% |
In terms of maximum drawdown, the strategy demonstrates better downside control than the overall market, indicating that it effectively mitigates the impact of extreme market volatility and enhances capital preservation.
The annualized return of the Maintenance Margin Ratio (MMR) strategy is slightly higher than that of the market benchmark, suggesting that the strategy delivers a degree of excess return, providing investors with superior profitability.
Regarding cumulative returns, the strategy outperforms the market over the long run, showcasing strong asset appreciation potential and consistent investment stability.
From the perspective of annualized volatility, the strategy exhibits lower fluctuation compared with the market, implying that it can generate attractive returns while taking on lower risk, thereby improving overall investment efficiency.
The Sharpe ratio is notably higher, meaning that the strategy provides better risk-adjusted returns than the benchmark and maintains stable performance across different market environments.
The Calmar ratio also significantly exceeds that of the market, reflecting stronger drawdown resilience and making the strategy particularly suitable for investors with higher risk awareness.
This strategy uses the Maintenance Margin Ratio (MMR) as its core indicator, aiming to capture rebound opportunities during periods of excessive market pessimism. The results demonstrate significant outperformance, with both long-term and short-term metrics exceeding the market benchmark. The annualized and cumulative returnshighlight the strategy’s potential for steady growth in a dynamic market environment.
Although the strategy experiences moderate volatility, its risk-adjusted performance—as evidenced by the higher Sharpe and Calmar ratios—indicates robust return stability. The superior drawdown control further confirms the strategy’s ability to withstand market turbulence and protect portfolio value during sharp downturns.
Overall, this strategy successfully applies the Maintenance Margin Ratio to gauge market sentiment and effectively captures excess returns during technical rebounds. It is well-suited for investors seeking steady growth in volatile markets, supported by solid risk management and consistent performance that can potentially outperform the broader market in the long term.
Investors are welcome to explore this framework further. TEJ will continue to introduce more data-driven strategies using the TQuant Lab platform—enabling users to backtest customized trading indicators with high-quality databases and design strategies that fit their unique investment style.
📘 Disclaimer: The analysis provided in this article is for informational purposes only and does not constitute investment advice or recommendations for any specific financial product.
【TQuant Lab Backtesting System】Solving Your Quantitative Finance Pain Points
