Table of Contents
The Relative Strength Index (RSI) is a widely popular oscillating technical indicator that calculates the relative strength between buyers and sellers. When the RSI is above 50, it indicates more substantial buying power; when the RSI is below 50, it signals more substantial selling power. In technical analysis, an RSI exceeding 70 is generally considered overbought, while an RSI below 30 is considered oversold. Moreover, RSI is a leading indicator, often anticipating price highs/lows, enabling early detection of market reversals and facilitating contrarian trading strategies.
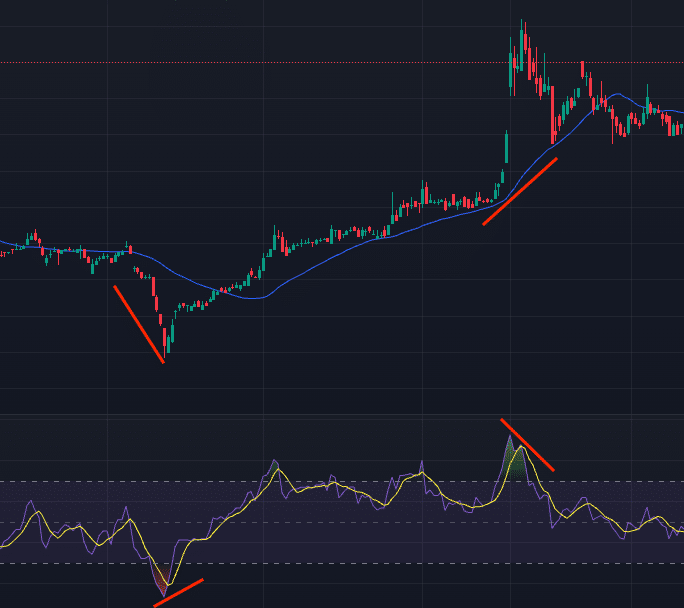
In addition, since RSI itself lacks directional information, we can complement it with moving averages to determine the market as illustrated bellow:

We can observe that the stock price increases when the moving average declines and the RSI rises above the low point in the oversold zone. Similarly, when the moving average ascends, and the RSI falls below the low point in the overbought zone, the stock price declines shortly afterward. J. W. Wilder, the developer of RSI, once mentioned that displaying divergence is the “greatest strength” of RSI.
The key to identifying the divergence lies in first drawing support/resistance lines on the RSI and then doing the same for the price. Look for the two troughs for the support line and the two peaks for the resistance line. If the direction of the lines is different, it indicates divergence, signaling a potential market reversal in the direction indicated by the RSI.
This article is composed in MacOS, utilizing Jupyter Notebook as the primary editor.
import os
os.environ['TEJAPI_KEY'] = "your key"
os.environ['TEJAPI_BASE'] = "https://api.tej.com.tw"
import pandas as pd
import numpy as np
import matplotlib.pyplot as plt

from zipline.data import bundles
from zipline.utils.calendar_utils import get_calendar
from zipline.sources.TEJ_Api_Data import get_Benchmark_Return
Data Period: January 1, 2021, to December 31, 2023
Using the get_universe function, obtain Chemical Biotechnology and Medical Care sectors stock pool. Additionally, the Chemical Biotechnology and Medical Care Return Index (IX0019) was included as a benchmark for market comparison.
from zipline.sources.TEJ_Api_Data import get_universe
start = '2021-01-01'
end = '2023-12-31'
pool = get_universe(start, end, mkt = 'TWSE', stktp_e = 'Common Stock', main_ind_e = 'M1700 Chemical Biotechnology & Medical Care')
print(f'total stock: {len(pool)}:\n', pool)

start_dt, end_dt = pd.Timestamp(start, tz='utc'), pd.Timestamp(end, tz='utc')
tickers = ' '.join(pool)
os.environ['ticker'] = tickers+' IX0019'
os.environ['mdate'] = start+' '+end
!zipline ingest -b tquant

bundle = bundles.load('tquant')
benchmark_asset = bundle.asset_finder.lookup_symbol('IX0019',as_of_date = None)
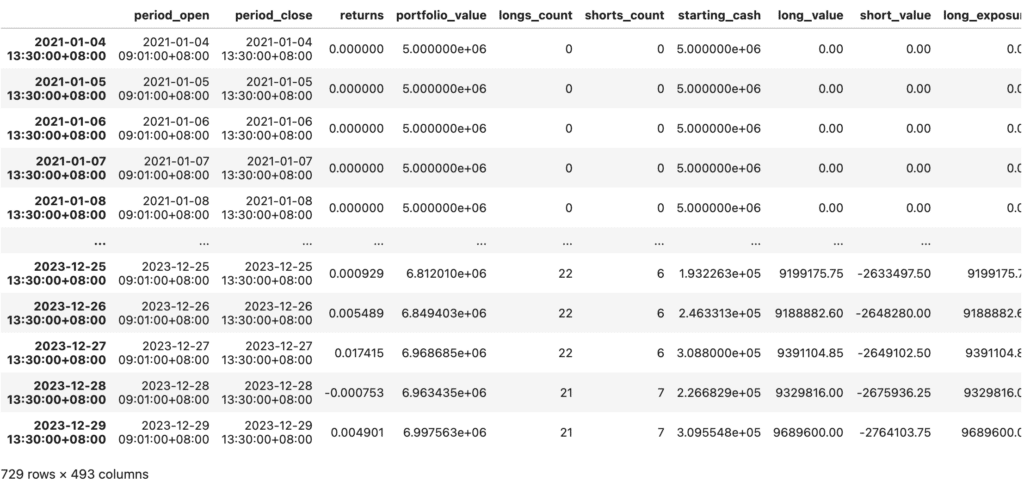
Execute the RSI Moving Average strategy with the run_algorithm() function, setting the trading period from start_time (2021-01-01) to end_time (2023-12-31). Utilize the dataset tquant and initialize the starting_cash to 5,000,000 NTD. The output, or results, will represent the daily performance and detailed transaction records.
from zipline import run_algorithm
results = run_algorithm(
    start = start_dt,
    end = end_dt,
    initialize=initialize,
    bundle='tquant',
    analyze=analyze,
    capital_base=5e6,
    handle_data = handle_data
)
results
import pyfolio as pf
from pyfolio.utils import extract_rets_pos_txn_from_zipline

returns, positions, transactions = pf.utils.extract_rets_pos_txn_from_zipline(results)
benchmark_rets = results.benchmark_return

# Creating a Full Tear Sheet
pf.create_full_tear_sheet(returns, positions = positions, transactions = transactions,
                          benchmark_rets = benchmark_rets,
                          round_trips=False)
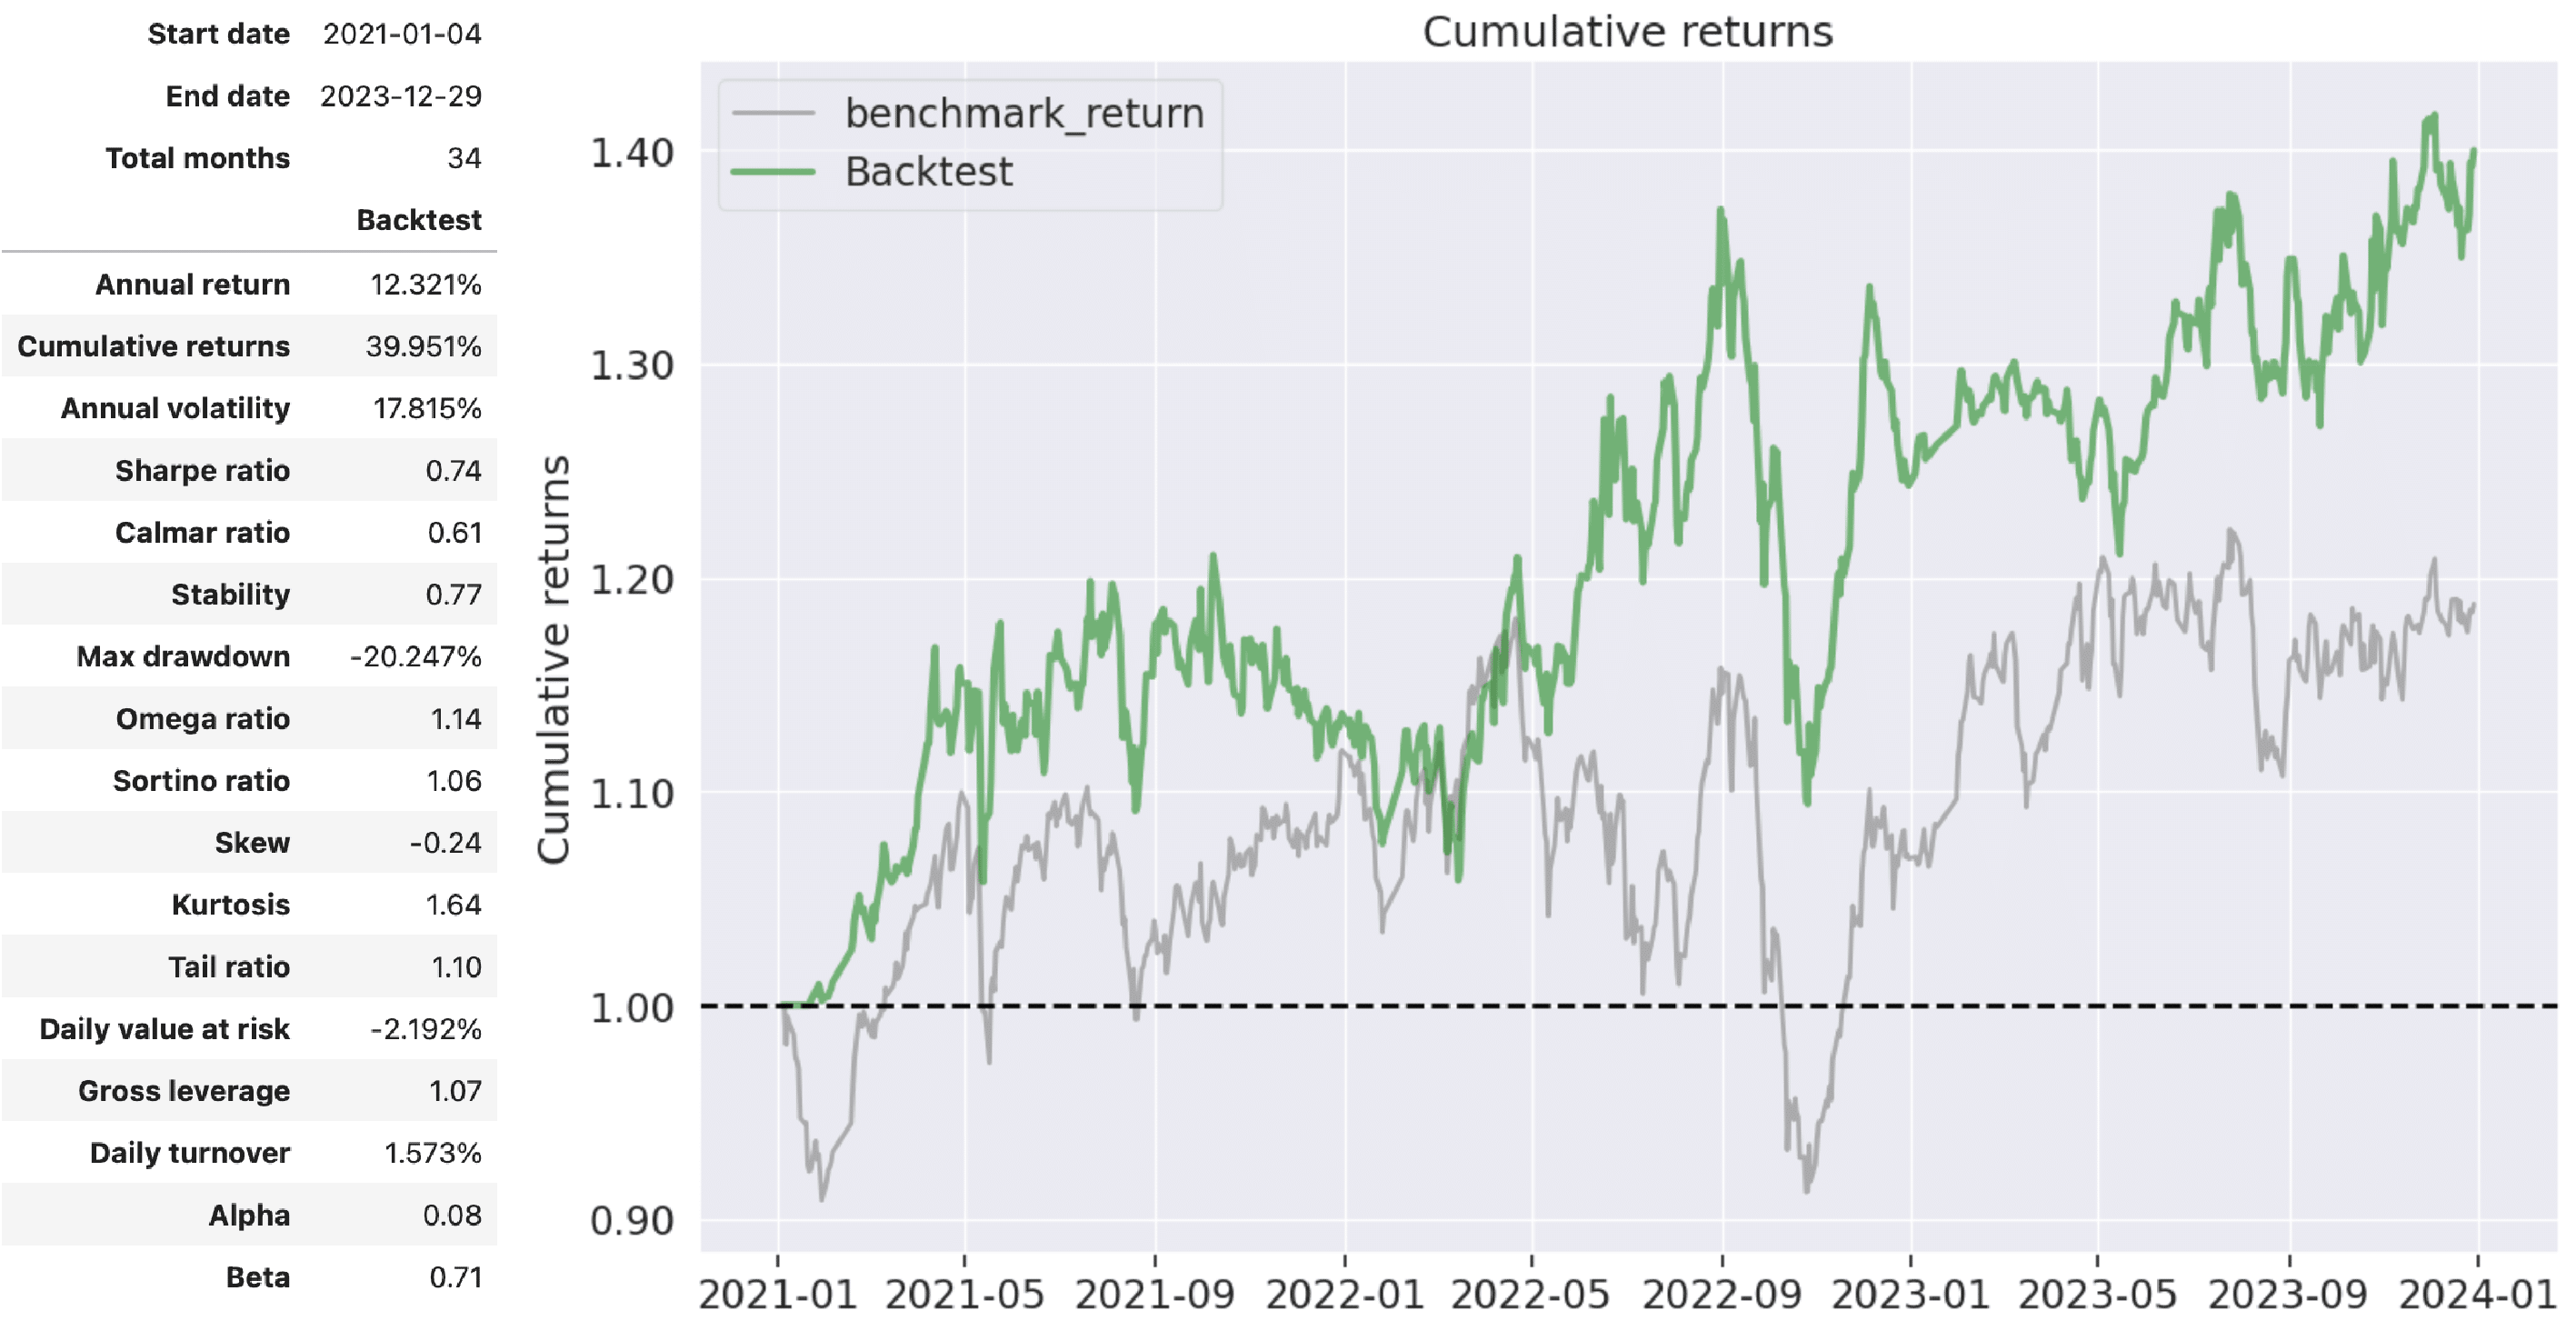
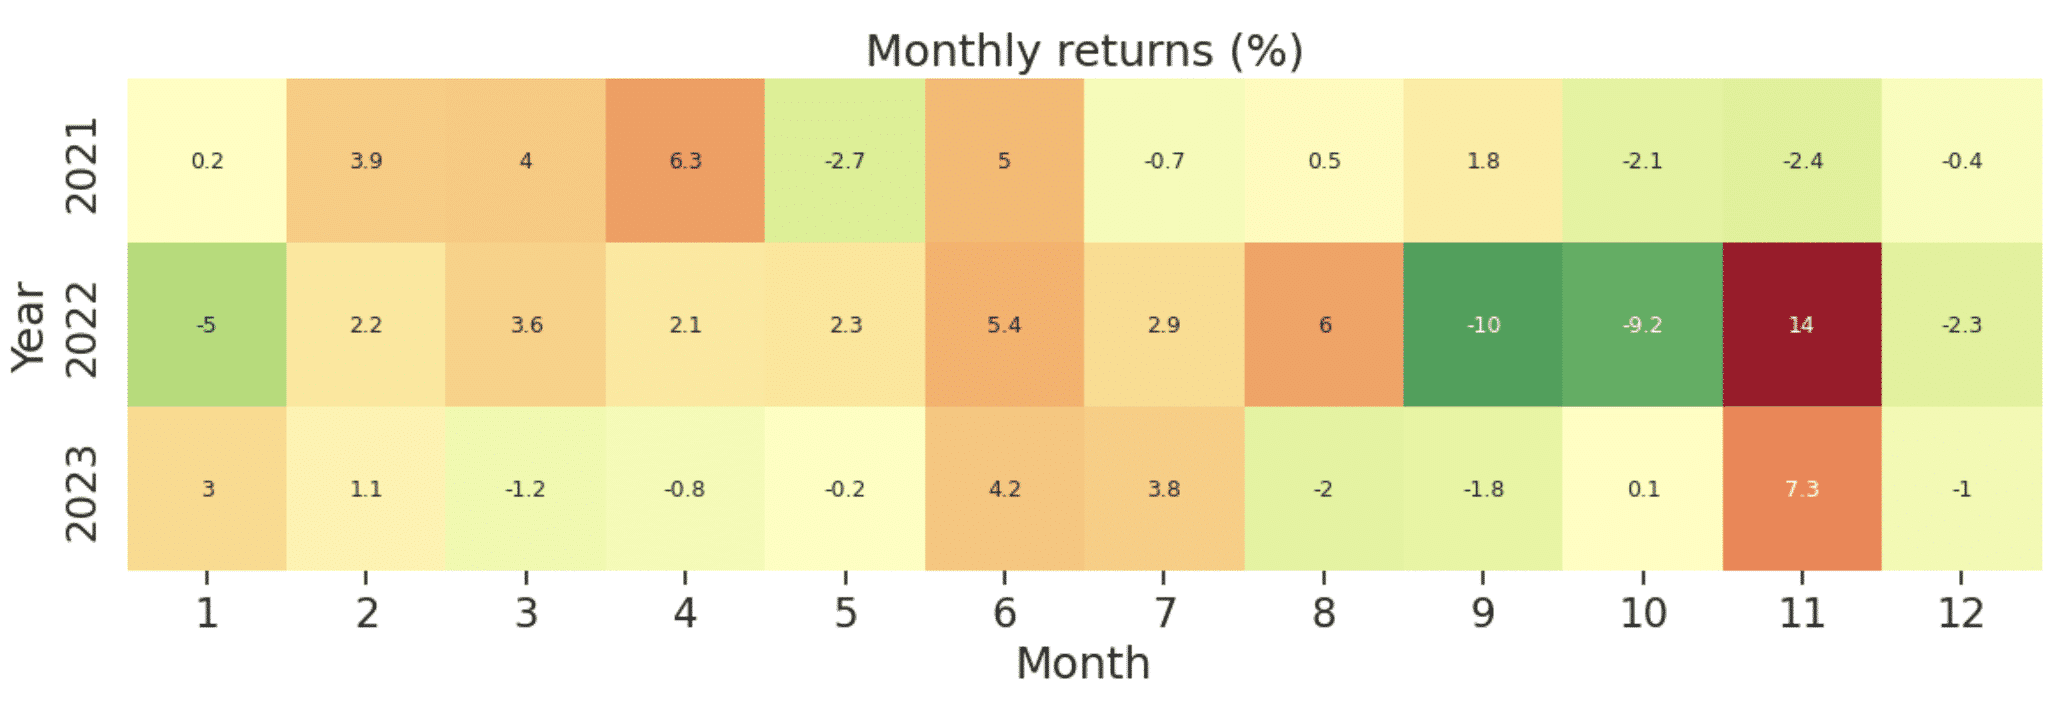
With the RSI Moving Average strategy, we observe an annualized return of approximately 12.32% over these 34 months, accumulating a total return close to 40%. The overall performance surpasses the market benchmark. However, the strategy’s reliance on reverse operations based on stock price fluctuations results in higher volatility, reaching around 17%. Regarding the Max Drawdown, it is noticeable that the overall market exhibited poor performance in Q3 and Q4 of 2022 due to factors such as the Fed’s interest rate hikes and the impact of the COVID-19 pandemic. As a consequence, the return rate of the RSI Moving Average strategy experienced a slight decline during this period.

This strategy utilizes RSI Divergence to anticipate stock price lows in advance, combining it with the directional guidance provided by simple moving averages for contrarian operations. Similarly, employing the RSI Moving Average strategy for short positions is also feasible, and investors are welcome to consider these approaches. In the future, we will continue to introduce the construction of various indicators using the TEJ database and backtest indicator performance. Therefore, for readers interested in multiple trading backtests, explore solutions offered by TEJ Databank! Utilize high-quality databases to construct trading strategies tailored to your preferences.
As a friendly reminder, this strategy is provided for reference only and does not refer to any product or investment advice.