
Table of Contents
In the stock market, the shareholding ratio of directors has always been a key indicator for investors. Changes in insider holdings often signal their confidence in the company’s future development and have potential impacts on stock prices. However, identifying meaningful changes in shareholding ratios from vast data can be challenging for investors.
To address this issue, we filter out companies with significant changes in the shareholding ratios of directors and conduct backtesting in Taiwan stock market. Through TEJ Director’s Holding database, we can efficiently uncover the potential relationship between management’s actions and stock price movements, and evaluate the performance of this strategy to help investors capture hidden opportunities in the market.
In this article, we will give you a comprehensive introduction to Directors’ Holdings and the comparison of three strategies based on the change of shareholdings. Curious about how to use director shareholding ratios to predict stock price trends and gain an edge in your investments? Let’s explore the secret of it in the following.
The directors’ and supervisors’ shareholding ratio refers to the proportion of shares held by the company’s directors and supervisors relative to the company’s total capital. The level of this ratio serves as one of the indicators of top management’s confidence in the company’s prospects. According to Article 2 of the “Regulations Governing the Shareholding Ratio of Directors and Supervisors of Public Companies and the Verification of Compliance”, companies are required to maintain a specific shareholding ratio for directors and supervisors based on their capital size. This legal restriction ensures that the interests of directors and supervisors align with those of the company, preventing decisions detrimental to the company’s long-term development and addressing agency problems.
Paid-up Capital | Minimum Shareholding Ratio of Directors and Supervisors | |
| Director | Supervisor | |
| Less than 300 million | At least 15% | At least 1.5% |
| Over 300 million to 1 billion | At least 10% | At least 1% |
| Over 1 billion to 2 billion | At least 7.5% | At least 0.75% |
| Over 2 billion to 4 billion | At least 5% | At least 0.5% |
| Over 4 billion to 10 billion | At least 4% | At least 0.4% |
| Over 10 billion to 50 billion | At least 3% | At least 0.3% |
| Over 50 billion to 100 billion | At least 2% | At least 0.2% |
| Over 100 billion | At least 1% | At least 0.1% |
Table 1. Shareholding ratios compiled by TEJ
When the shareholding ratio of a company’s directors and supervisors is high, it is often seen as a sign of the management’s active involvement in the company’s operations. This is because their financial interests are closely tied to the company’s performance. Moreover, it enhances external investors’ confidence in the company’s future, contributing to the stability of the internal management team. External investors are likely to have a more optimistic outlook on the company’s long-term development when they see management “standing with the company.” This trust can lead to positive market reactions, potentially driving the stock price higher.
In addition, a high directors’ and supervisors’ shareholding ratio may indicate that management has a stronger voice in corporate governance, enabling them to more effectively implement strategic decisions. For a company with a clear development direction, this can enhance its competitiveness in the market.
When the directors’ and supervisors’ shareholding ratio is low or significantly decreases, the market may interpret this negatively. A reduction in management’s shareholding can be seen as a lack of confidence in the company’s future prospects or even as a sign of adverse changes within the company. In such cases, external investors may grow concerned about the company’s future performance and may choose to reduce their investments or withdraw entirely.
This shift in market sentiment often has a negative impact on the company’s stock price. Particularly in cases where directors and supervisors significantly reduce their holdings, panic selling may occur, causing the stock price to plummet rapidly. Furthermore, a low shareholding ratio among directors and supervisors could mean weaker management influence in corporate governance, making the company more susceptible to external interference—a potential risk to the company’s long-term stable operations.
After understanding the shareholding ratio restrictions in Taiwan and how the level of shareholding ratio may reflect management’s confidence in their own company, this article will outline three investment strategies based on the TEJ shareholding ratio database. These strategies will then be evaluated using a backtesting system to assess their strengths and weaknesses, providing investors with guidance on how to use directors’ shareholding data to develop effective strategies.
We analyze changes in director shareholding using three strategies, with the backtesting period set from January 1, 2020, to December 31, 2023. According to Article 25, Paragraph 2 of the Securities and Exchange Act, the shareholding ratios of directors must be disclosed by the 15th of each month for the preceding month. Therefore, we set the rebalancing date for these strategies on the 16th of each month.
Here are three strategies according to different criteria:
These strategies will be referred to as Strategy 1, Strategy 2, and Strategy 3 in the following analysis. To enhance the realism of the strategies, we incorporate slippage and transaction fees into the model. This allows us to simulate the impact of price friction on trading outcomes during order execution.
The following demonstrates how we will generate the trading signals required for the Shareholding Strategy.
We set the following data and rule to backtest:
After obtaining price-volume and historical data, we set up the 3 strategies:
According to Article 25, Paragraph 2 of the “Securities and Exchange Act”, the shareholding ratios of directors and supervisors must be disclosed before the 15th of each month for the previous month’s data. Therefore, the strategy rebalancing date is set as the 15th of each month.

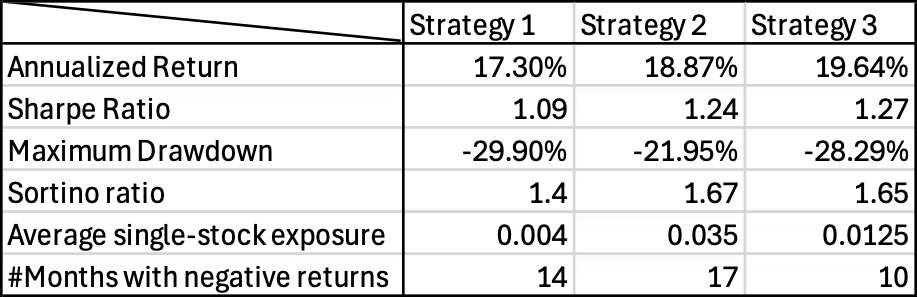
Table 2. The comparison of three strategies
From the data above, the annualized returns for the three strategies are 17.3%, 18.87%, and 19.64%, all outperforming the market. However, observing the performance charts reveals that Strategy 1 l underperformed the market for most of the time before 2023, while Strategy 2 and Strategy 3 experienced fluctuations, achieving noticeably superior performance only in the later stages. This indicates that these strategies may struggle to outperform the market in the short term and require long-term holding to fully realize their advantages.
Furthermore, the Sharpe ratios for the three strategies are 1.09, 1.24, and 1.27, showing that Strategy 3 delivers the best risk-adjusted returns. This further confirms that the ratio of director holding possesses predictive power. However, these strategies still require the patience of long-term holding to unlock their full investment potential.
Finally, the maximum drawdowns are –29.9%, -21.95%, and -28.29%. For conservative investors, it is recommended to assess their risk tolerance to ensure they can maintain a stable mindset and respond appropriately during significant market fluctuations, avoiding adverse impacts on investment decisions caused by emotional stress.
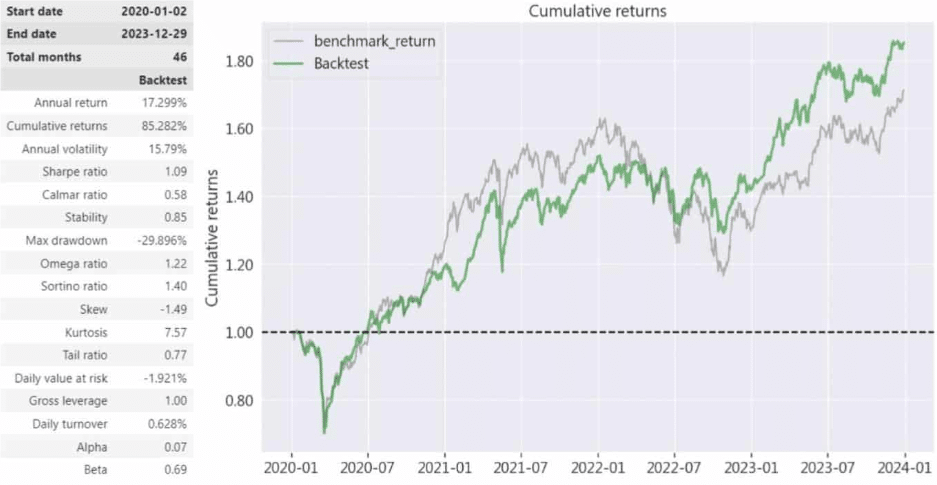
Figure 1. The results of Strategy 1
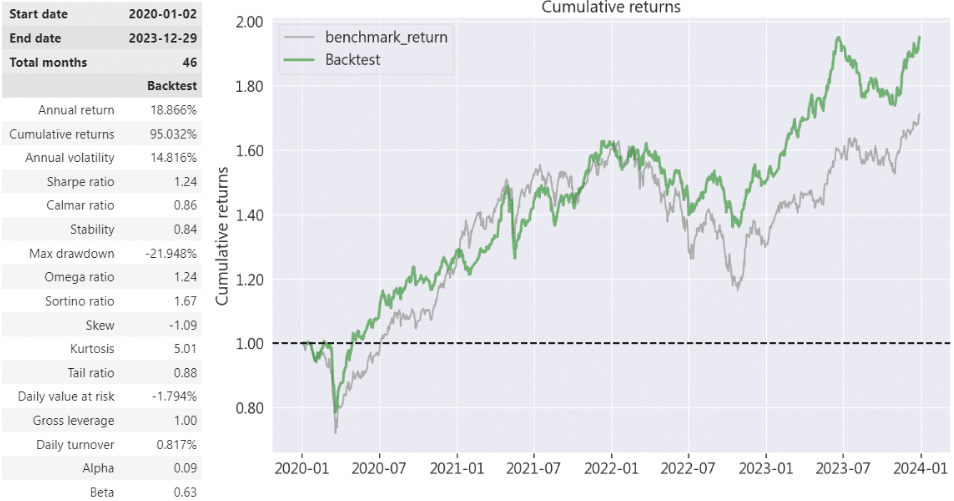
Figure2. The results of Strategy 2
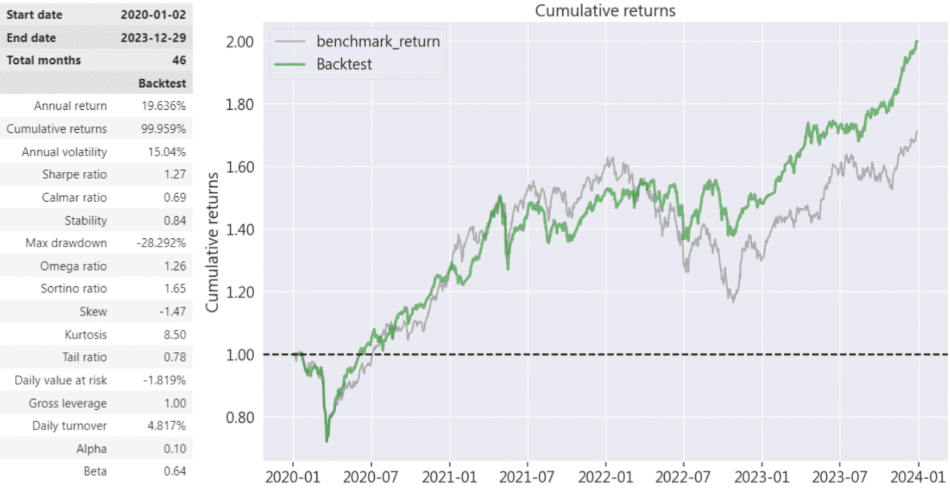
Figure 3. The results of Strategy 3
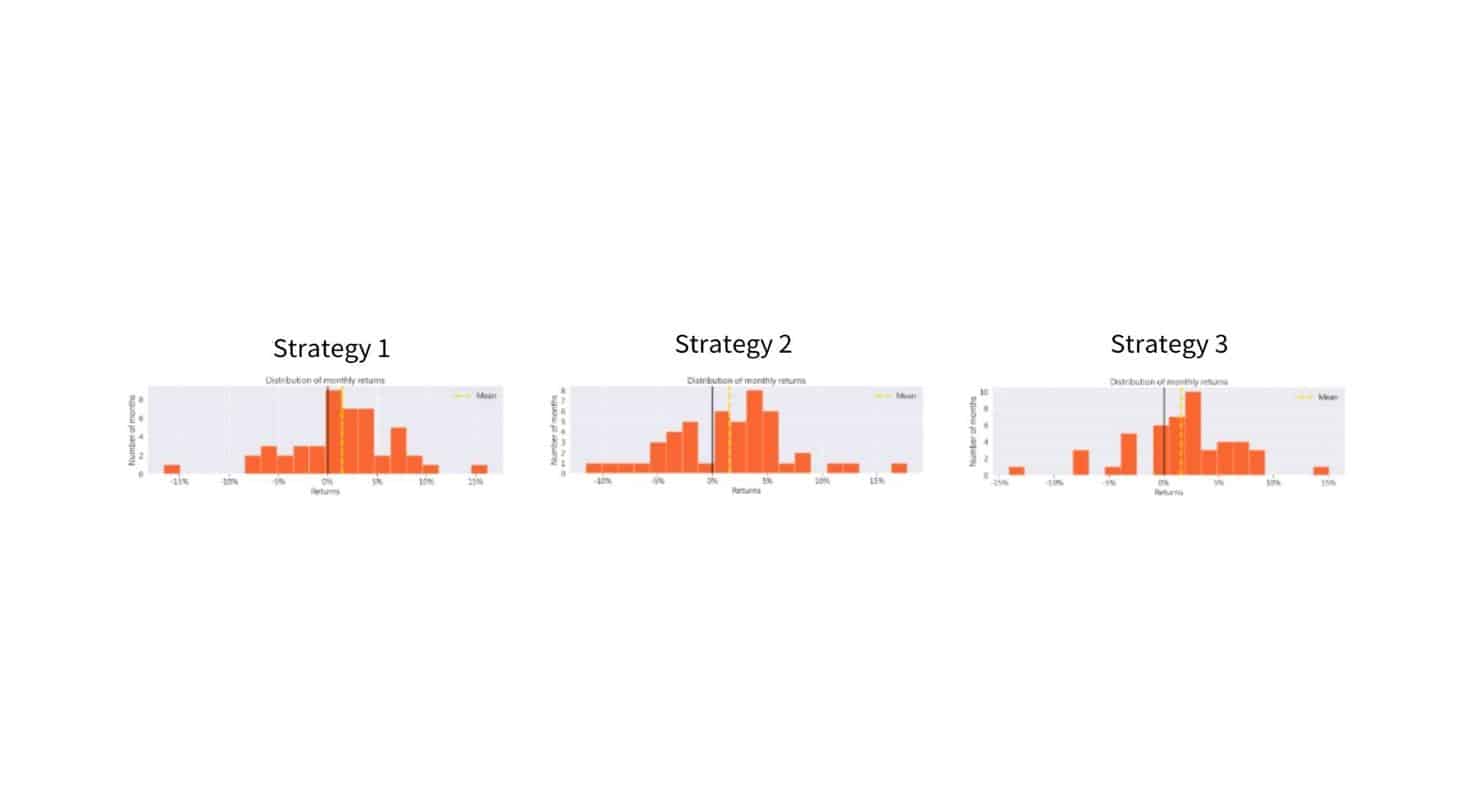
Figure 4. The number of months with negative returns
From the chart, it can be observed that the number of months with negative returns for the three strategies are 14, 17, and 10 months, respectively. Strategy 1 and Strategy 2 experienced more months of negative returns, which could expose investors to greater fluctuations during the holding period, potentially affecting their confidence and patience in executing the strategies. In contrast, Strategy 3 had the fewest negative return months at just 10, achieving stable returns with fewer loss months, thereby reducing stress for investors.
Additionally, the Sortino ratios for the three strategies are 1.4, 1.67, and 1.65, indicating that Strategy 2 and Strategy 3 provide better risk-adjusted returns. Strategy 3 not only has the fewest months with negative returns but also maintains a high Sortino ratio, highlighting its risk management advantages. This allows investors to remain confident in following the strategy even during periods of downside risk.
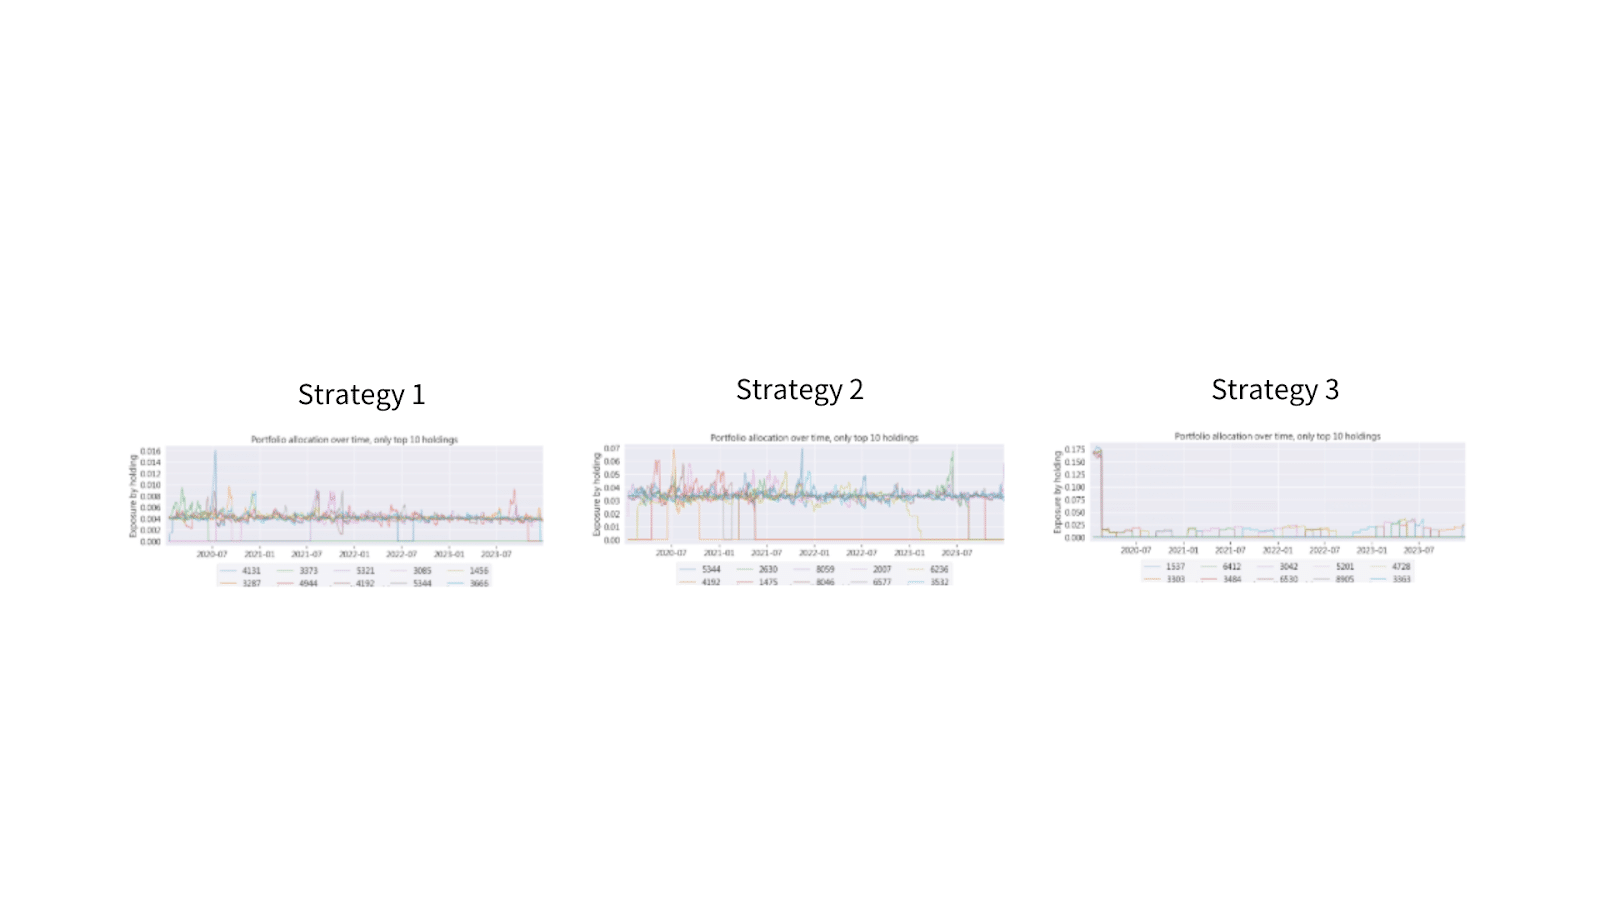
Figure 5: TOP 10 stock exposures for each strategy
Further analysis of the TOP 10 stock exposures for each strategy reveals that the average single-stock exposure is 0.004, 0.035, and 0.0125, respectively. This indicates that Strategy 1 holds the largest number of stocks, followed by Strategy 3, and lastly Strategy 2.
However, the maximum drawdowns for Strategies 1 to 3 are -29.9%, -21.95%, and -28.29%, respectively. Although Strategy 1 attempts to mitigate risk by holding more stocks, it still fails to reduce its downside risk. This also results in Strategy 1 having the lowest Sortino ratio among the three strategies.
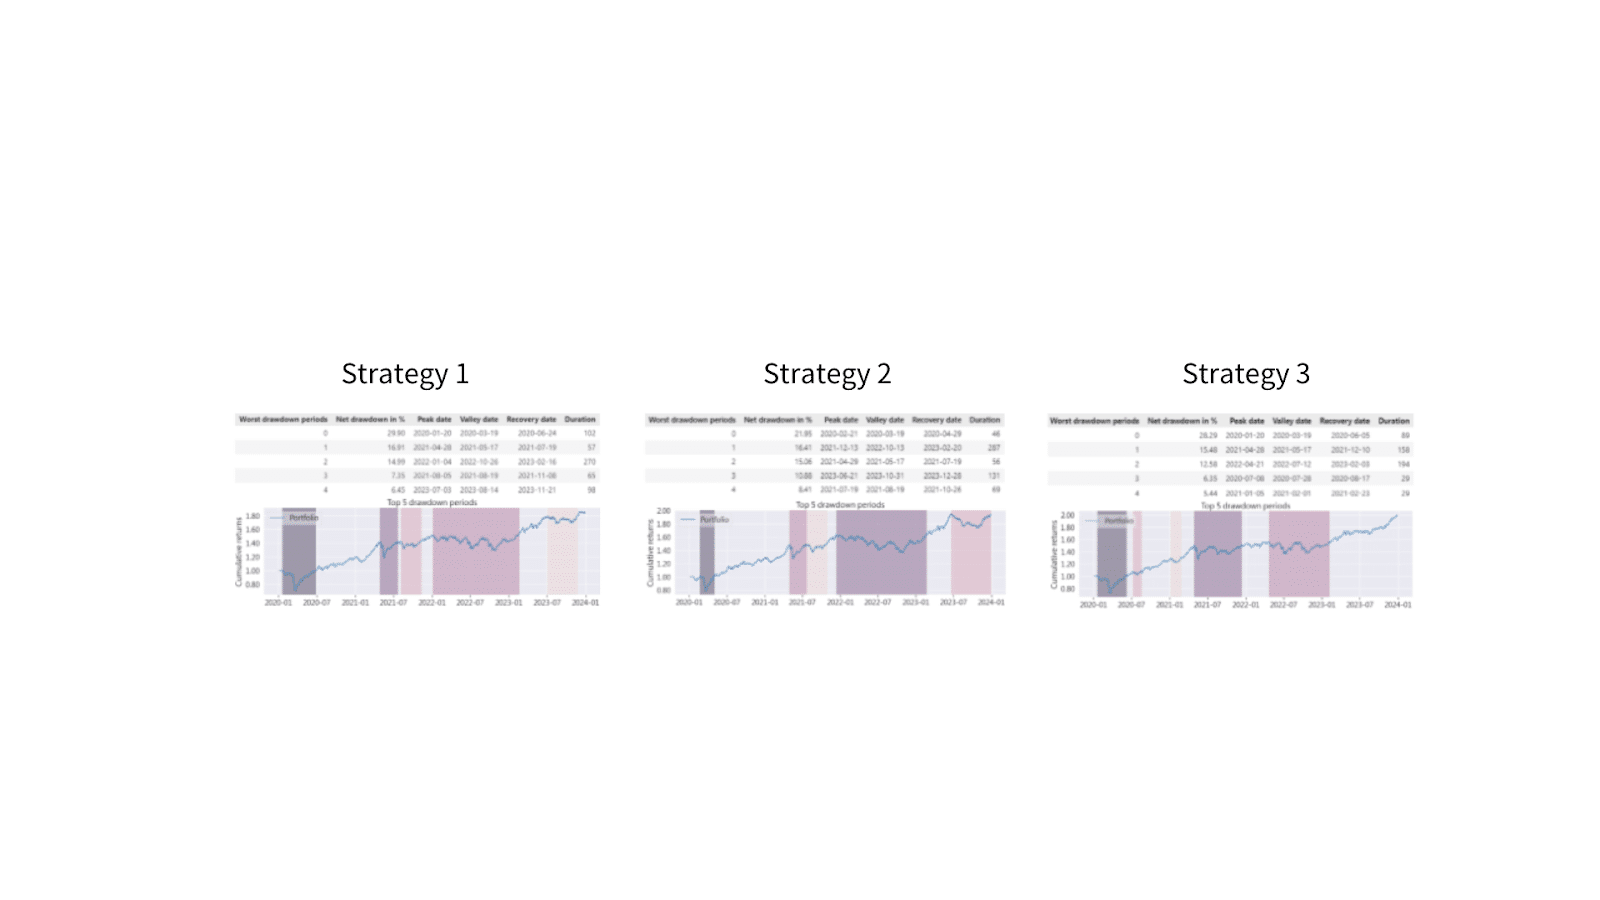
Figure 6: Maximum drawdowns for each strategy
Finally, we analyze the top five drawdowns using the chart. The data shows that the average drawdown durations are 118.4 days, 117.8 days, and 99.8 days, with the longest drawdown periods concentrated in 2022. Over the approximately 1,000 trading days spanning four years, the days with significant drawdowns account for around 10% to 12%. This highlights that investors executing such strategies must be mentally prepared and ready to handle potential long-term fluctuations.
From the results of the three strategies, each strategy exhibits different risk and return characteristics. Strategy 3 demonstrates greater stability, while Strategy 2 achieves the smallest drawdown. Notably, all three strategies, constructed by the shareholding ratio of directors, outperform the market in terms of returns with Sharpe ratios exceeding 1, confirming the predictive power of this approach.
Among the three strategies, we consider Strategy 2 and Strategy 3 as reliable options. Their entry and exit conditions can be further tailored to meet investors’ preferences. In contrast, Strategy 1, based on high shareholding ratios, still has room for improvement.
Applying the shareholding ratio of directors can achieve superior risk-adjusted returns over the long term, making it suitable for conservative investors seeking stable performance. However, the length and frequency of drawdown periods emphasize that these strategies are not short-term arbitrage tools but better suited for investors with patience.
Making informed investment decisions in Taiwan’s stock market requires access to reliable and detailed data. TEJ’s Fundamental Data service, which includes extensive director and supervisor shareholding information, provides investors with the tools needed to develop precise and effective strategies.
With features like Point-in-Time Data, TEJ ensures that all historical information is time-accurate and free from lookahead bias, enabling the creation of trustworthy investment models. This level of data precision helps investors gain deeper insights into market dynamics and uncover valuable opportunities with confidence.
For those focused on building long-term, stable strategies, TEJ’s database is an indispensable resource. From director shareholding ratios to broader financial and corporate data, TEJ offers a robust platform tailored to the nuances of Taiwan’s market.
Discover how TEJ’s Fundamental Data can elevate your investment strategies: TEJ Fundamental Data.
2024 New Independent Director Regulations hits the road! What impacts may be led to?
