
Table of Contents
交易是一件充滿挑戰的事,許多全職交易員的年度績效甚至無法超越大盤。這讓我開始思考,是否有一個簡單卻能有效擊敗大盤的交易策略。
在台灣股市中,有一個有趣的現象:當一些股票大幅上漲時,總有人開始討論是否應該追進,擔心一進場就可能被套牢在高點,但又害怕錯過了進場的機會。
因此,我設計了一個簡單的選股策略,並結合不同週期的動能進行回測,來探討這個策略的績效表現,提供讀者作為參考。
在選股過程中,我們希望避免選到成交量過小、容易被大戶或法人操控導致劇烈波動的股票。為了減少這類風險,我們會在每年篩選市值前 200 大的公司作為股票池,確保所選股票具備較高的流動性與市場深度。
選定股票池後,我們針對每檔個股計算過去一個月份(時間長度可根據需求調整)的收盤價,來評估其中長期動能,並從中挑選動能表現前五強的股票。這樣的選股方法有助於捕捉市場中的強勢股趨勢。
• 每個月的第一個交易日買入前期動能前五強的股票,並且賣出上期持有股票,若個股連續兩期皆屬於前五名,則持續持有且不平倉,並將五檔股票部位大小都利用order_target_percent調整為投資組合價值的20%。
此策略設計的目的是模擬在不需要長時間盯盤且不受當日股價波動干擾的情況下進行投資。我們會在每月的月底先計算出前期動能,並在每月的第一個交易日收盤前一分鐘買入動能前五高的股票,同時賣出上期持有但這期未被選擇的股票。此外,策略中會設定滑價功能,以模擬下單時股價的摩擦成本對交易的影響。這樣的設計既簡單又有效,適合不希望頻繁操作的投資者。
# 載入常用套件
import numpy as np
import pandas as pd
import matplotlib.pyplot as plt
# 設定環境變數(TEJ金鑰)
import tejapi
import os
os.environ['TEJAPI_BASE'] = 'https://api.tej.com.tw'
os.environ['TEJAPI_KEY'] = 'your_key'

# 回測系統需要的套件
from zipline.sources.TEJ_Api_Data import get_universe
from zipline.data import bundles
from zipline.sources.TEJ_Api_Data import get_Benchmark_Return
from zipline.pipeline.mixins import SingleInputMixin
from zipline.pipeline.data import TWEquityPricing
from zipline.pipeline.factors import CustomFactor
from zipline.pipeline import Pipeline
from zipline.TQresearch.tej_pipeline import run_pipeline
from zipline import run_algorithm
在選擇回測的時間點時,選擇當時市值前 200 大的公司作為股票池(避免前視偏誤),以確保所選股票具備較高的流動性與市場深度。檢查股票池是否涵蓋具有不符策略目標特徵的股票。
pool = get_universe(start = '2018-01-01',
                    end = '2025-04-10',
                    mkt_bd_e = ['TSE'],  # 已上市之股票
                    stktp_e = 'Common Stock'
)資料期間從 2018-06-01 至 2025-04-10,並導入上述 200 檔股票的價量資料與加權股價報酬指數 ( IR0001 ) 作為績效比較基準。
# 設定回測期間與起始時間,'start' 設定為 '2018-06-01',以確保能計算 2019-01-01 的動能
# (起始時間依據所需的動能計算長度設定,回測期間為 2019/01/01 ~ 2025/04/10)
start = '2018-06-01'
end = '2025-04-10'

# 設定環境變數以指定回測時間範圍與選定的股票池
os.environ['mdate'] = start + ' ' + end
os.environ['ticker'] = ' '.join(pool) + ' ' + 'IR0001'

# 執行資料擷取
!zipline ingest -b tquant有了價量資料後,我們可以利用 CustomFactor 函式來建構我們需要的動能指標。此函式會根據每支股票指定時間長度(window_length)的收盤價變化計算出該股票的動能。
from zipline.pipeline.filters import StaticAssets

class Momentum(CustomFactor):
    inputs = [TWEquityPricing.close]
    # 設定不同時間跨度的動能計算,這裡以一個季度, 20天為例
    window_length = 20

    def compute(self, today, assets, out, close):
        # 計算動能:以收盤價變化計算報酬率,並四捨五入至小數點後五位
        return_rate = (((close[-1] - close[0]) / close[0]) * 100).round(5)
out[:] = return_rate在這段程式,Momentum() 繼承了 CustomFactor 並設定計算動能的邏輯。window_length 指定計算期間的長度(例如 20 天),動能透過首尾收盤價的變化來計算,並將結果輸出。這樣的方式讓我們能輕鬆計算出每支股票在指定期間內的動能。
Pipeline() 提供使用者快速處理多檔標的的量化指標與價量資料的功能,於本次案例我們用以處理:
# 重新定義開始及結束日期,用於回測期間
start = '2019-01-01'
end = '2025-04-10'
start_dt, end_dt = pd.Timestamp(start, tz='utc'), pd.Timestamp(end, tz='utc')
bundle = bundles.load('tquant')
benchmark_asset = bundle.asset_finder.lookup_symbol('IR0001', as_of_date=None)

def make_pipeline():
    # 使用自定義的動能指標
    mom = Momentum()
    # 取得最新的收盤價
    curr_price = TWEquityPricing.close.latest

    return Pipeline(
        columns={
            'curr_price': curr_price,
            'Momentum': mom
        },
        # 過濾掉基準指數,僅篩選個股
        screen=~StaticAssets([benchmark_asset])
    )

my_pipeline = run_pipeline(make_pipeline(), start_dt, end_dt)
dates = my_pipeline.index.get_level_values(0).unique()
my_pipeline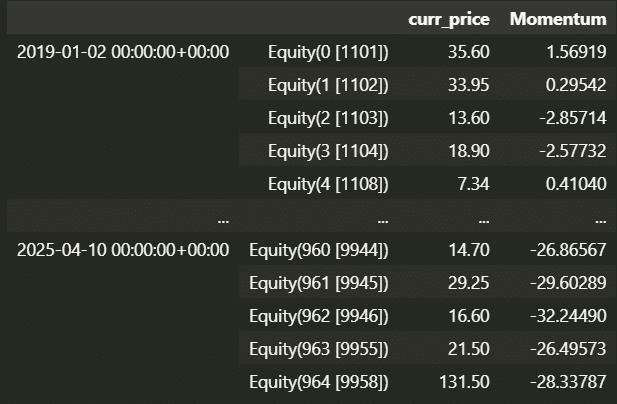
initialize() 函式用於定義交易開始前的每日交易環境,與此例中我們設置:
from zipline.finance import slippage, commission
from zipline.api import *
from zipline.api import set_slippage, set_commission, set_benchmark, attach_pipeline, order, order_target, symbol, pipeline_output, record
def initialize(context):
    context.holding_stock    = False
    context.target           = None
    context.targets = []
    context.last_rebalance_day = None

    context.stock_buy_price  = 0
    context.rebalance_period    = 20 #可以自行調整


    set_slippage(slippage.FixedBasisPointsSlippage(basis_points=50.0, volume_limit=1))
    set_commission(commission.PerShare(cost=0.001425 + 0.003/2))
    attach_pipeline(make_pipeline(), 'mystrats')
    set_benchmark(symbol('IR0001'))

    # 每年只更新一次:用去年的最後一個交易日市值排名前200
    context.top200_by_year = {}
    for Y in years:
        # 抓取「去年」全年所有交易日(包含時區)
        sessions = calendar.sessions_in_range(
            pd.Timestamp(f"{Y-1}-01-01", tz=tz),
            pd.Timestamp(f"{Y-1}-12-31", tz=tz),
        )
        last_session = sessions[-1]  # 直接取最後一個元素,已含 tz

        dt_str = last_session.strftime('%Y-%m-%d')
        cap = TejToolAPI.get_history_data(
            start   = dt_str,
            end     = dt_str,
            ticker  = pool,
            columns = ['Market_Cap_Dollars']
        )
        #print(f"Year: {Y}, Date: {dt_str}")
        coids = (
            cap.sort_values('Market_Cap_Dollars', ascending=False)
               .head(200)['coid']
               .tolist()
        )
        # 轉成 Zipline 的 Asset
context.top200_by_year[Y] = [symbol(c) for c in coids]handle_data() 是構建交易策略的重要函式,它會在回測期間的每個交易日被呼叫。這個函式的主要任務是設定交易策略、執行下單以及紀錄交易資訊。
如同在文章開頭所提到的,我們的策略只需根據日期來判斷是否為當月的月初或月末,並根據當時的動能值來決定要買入哪檔股票。
策略總結:
• 進場條件:當日期為每個月的第一個交易日,且選定的股票動能前五高(可視需求調整)時進場。
• 出場及續抱條件:在每個月的第一個交易日,先將這期未被選擇之股票賣出,並且將持續被選擇之股票續抱。此外,也可根據自定義的止盈止損條件提前出場。
def handle_data(context, data):
    # 取得當天 pipeline output(index=Asset, columns 包含 'Momentum')
    out_dir = pipeline_output('mystrats')
    current = context.get_datetime().normalize()
    y, m, d = current.year, current.month, current.day

    # 抓本月第一個交易日
    mdays     = dates[(dates.year == y) & (dates.month == m)]
    first_day = mdays.min().day

    # 只在月初做重平衡
    if d == first_day:

        universe = context.top200_by_year.get(y, [])

        today_df = out_dir.loc[out_dir.index.isin(universe)]
        if today_df.empty:
            return


        top5 = today_df['Momentum'].nlargest(5).index.tolist()


        prev    = context.targets
        to_drop = set(prev) - set(top5)
        for asset in to_drop:
            order_target_percent(asset, 0)
            print(f"Drop {asset}")


        weight = 1.0 / len(top5)
        for asset in top5:
            order_target_percent(asset, weight)
            print(f"Rebalance {asset} to {weight:.0%}")


        context.targets = top5

def analyze(context, perf):
    pass
如果想要自行設定再平衡日,可以將handle data換成以下程式碼,並且將initialize的context.rebalance_period調整成自己需要的再平衡天數
def handle_data(context, data):

    out_dir = pipeline_output('mystrats')
    current = context.get_datetime().normalize()


    if context.last_rebalance_day is None:
        context.last_rebalance_day = current


    days_since = (current - context.last_rebalance_day).days
    if days_since < context.rebalance_period:
        return

    context.last_rebalance_day = current

    y        = current.year
    universe = context.top200_by_year.get(y, [])
    #  直接用單層 index 篩選
    today_df = out_dir.loc[out_dir.index.isin(universe)]
    if today_df.empty:
        return

    top5 = today_df['Momentum'].nlargest(5).index.tolist()

    prev    = context.targets
    to_drop = set(prev) - set(top5)
    for asset in to_drop:
        order_target_percent(asset, 0)
        print(f"Drop {asset}")

    weight = 1.0 / len(top5)
    for asset in top5:
        order_target_percent(asset, weight)
        print(f"Rebalance {asset} to {weight:.0%}")

context.targets = top5使用 run_algorithm() 來執行上述設定的動能策略,資料集使用 tquant,初始資金設定為 10,000,000 元。執行過程中,輸出的 results 包含每日績效和交易明細。
在進行繪圖時,為了避免字體錯誤,先進行字體設定:
# 設定字體,避免字體錯誤
plt.rcParams['font.family'] = 'Arial Unicode MS'
plt.rcParams['font.sans-serif'] = ['Arial Unicode MS']

# 執行回測
results = run_algorithm(
    start = start_dt,
    end = end_dt,
    initialize=initialize,
    bundle='tquant',
    analyze=analyze,
    capital_base=1e7,
    handle_data = handle_data
)
results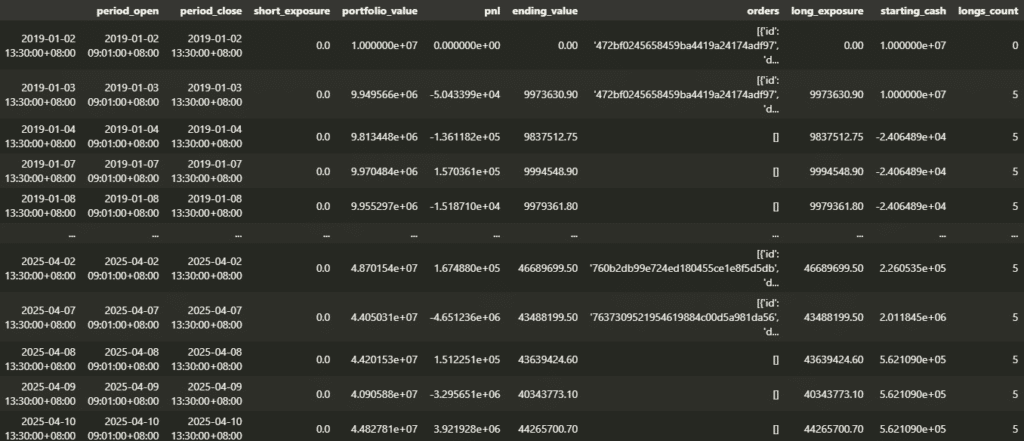
from pyfolio.utils import extract_rets_pos_txn_from_zipline
import pyfolio as pf

# 從 results 資料表中取出 returns, positions & transactions
returns, positions, transactions = extract_rets_pos_txn_from_zipline(results)
benchmark_rets = results.benchmark_return  # 取出 benchmark 的報酬率

# 繪製 Pyfolio 中提供的所有圖表
pf.tears.create_full_tear_sheet(returns=returns,
                                     positions=positions,
                                     transactions=transactions,
                                     benchmark_rets=benchmark_rets
                                    )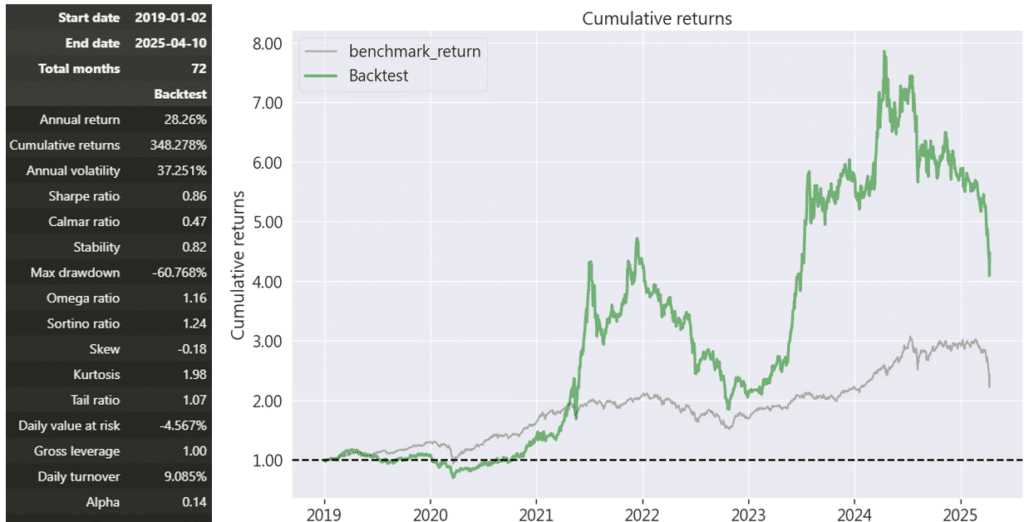
從上圖數據中可以看出,這個策略的年化報酬率達到 28.26%,但同時伴隨著 37.251% 的高波動度,顯示出策略雖有潛力帶來高額收益,但風險同樣不小。因此,這個策略適合追求高回報且能承受較大波動的投資者,對於保守型投資者則可能不太合適。
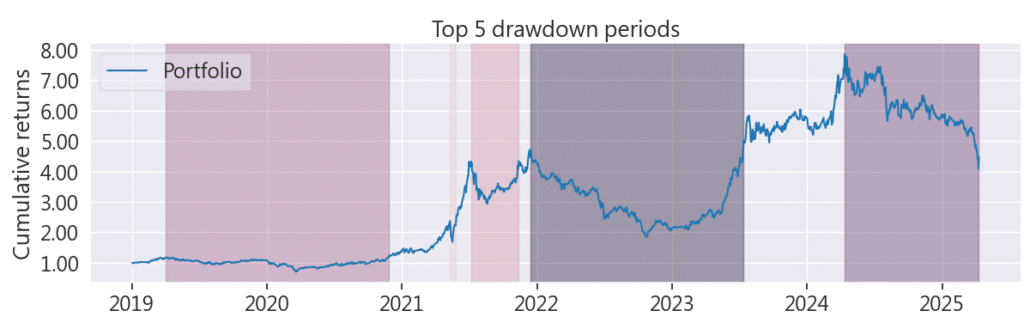
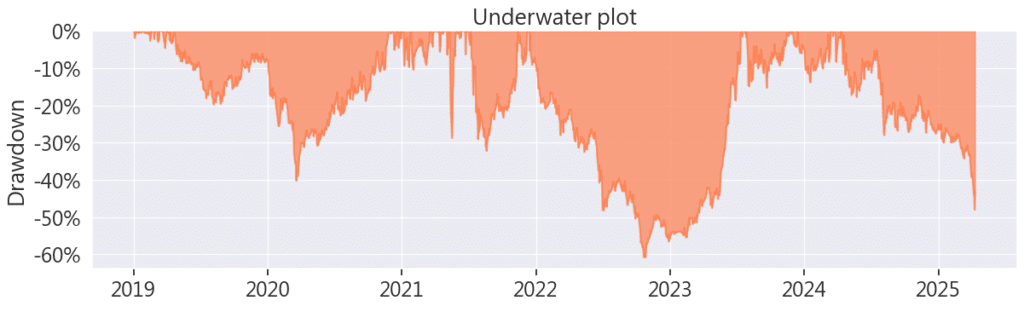
在回檔比率圖中,可以看到此策略的波動程度非常大,並且時常會有很大的回檔。
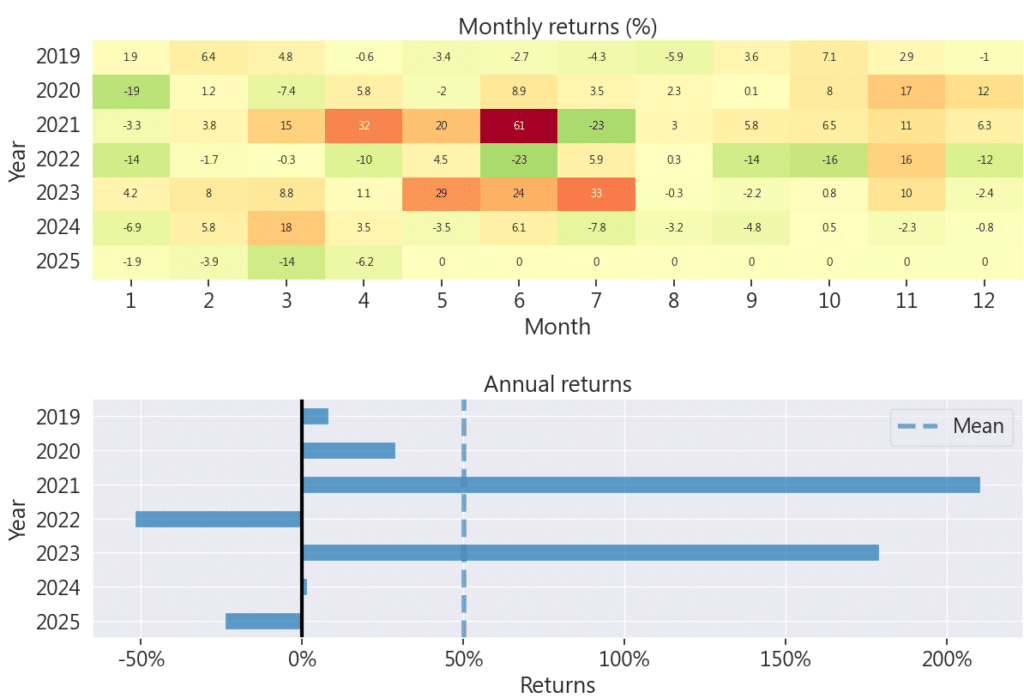
從年化報酬和月報酬的圖表可以看到,這個策略的缺點在於波動較大,資金能夠翻倍的主要原因是 2021 年期間捕捉到了陽明海運的飆漲。我認為這正是這個策略的價值所在:即使經歷了多次虧損,透過抓住幾次大的趨勢性機會,依然能實現資本的顯著增長。
本次策略是一個很有趣的議題,究竟該不該「上車」,相信讀者心中都有自己的答案。即便我已將股票池範圍限定在市值前 200 大的公司,試圖降低被操控的風險,但當選出動能前五大的股票時,這些股票仍往往是短期內飆漲的個股。這類股票過去一個月的強勁表現可能已經接近尾聲,但也可能繼續享受後續的漲幅。
在這次策略中,獲得高額利潤的關鍵在於在承擔高風險的同時,成功持有了那些具備強勁上漲動能的股票。以 2021 年為例,策略受益於陽明海運的爆發性漲勢;在 2024 年,即便經歷了超過 10% 的跌幅,股票仍強勢回升,帶來可觀的獲利。但是在2025年關稅戰,他的表現甚至比大盤差許多,因此如果有興趣的讀者可以根據自己想驗證的情境自行調整代碼,設定止盈止損條件,策略的主要邏輯已經完善,靈活調整即可,這樣可以驗證不同設定對策略績效的影響。