Table of Contents
In recent years, the low-volatility anomaly has gained widespread attention for challenging traditional asset pricing theory. This article takes a closer look at one key driver behind the anomaly—Idiosyncratic Volatility (IVOL)—through a comprehensive analysis of the Taiwan stock market. Using point-in-time data from the TEJ Factor Library, we investigate the statistical behavior of IVOL, its relationship with stock characteristics, and its implications for cross-sectional return prediction.
Traditional asset pricing theory suggests a positive relationship between risk and return—higher risk should yield higher expected returns. Yet empirical evidence often contradicts this: stocks with lower historical volatility tend to outperform, even after adjusting for risk. This phenomenon is known as the low-volatility anomaly.
Early research by Black (1972) observed that the link between beta and realized returns was flatter than theory predicts. Later studies confirmed that low-volatility stocks consistently generate excess returns across markets and time periods, even after controlling for known factors like size, value, and momentum. These findings challenge the capital asset pricing model (CAPM) and have led to the rise of Smart Beta strategies and low-volatility ETFs.
Behavioral explanations include the lottery preference—investors overpay for high-volatility stocks in hopes of outsized gains, leading to long-term underperformance. Others cite overconfidence and representativeness bias, which further inflate expectations for volatile growth stocks.
In Taiwan, ETFs like Cathay TIP TAIEX+ Low Volatility Select 30 ETF(00701) and Yuanta Taiwan High Dividend Low Volatility ETF(00713) have gained popularity by combining low volatility and high dividend yields, offering stable returns to risk-averse investors.
However, recent literature suggests these returns may be explained by other factor exposures. Novy-Marx (2014) and Fama & French (2015) show that once profitability and investment factors are included, the anomaly weakens. Others argue that performance depends on market cycles, making the low-volatility premium inconsistent.
Still, some anomalies—especially those tied to idiosyncratic risk—resist easy explanation. One such case is the Idiosyncratic Volatility Puzzle.

While systematic risk is central to asset pricing, idiosyncratic volatility (IVOL)—risk unique to an individual stock—is theoretically diversifiable and should not influence returns. Yet empirical evidence shows otherwise: stocks with higher IVOL often deliver significantly lower future returns.
Ang et al. (2006, 2009) documented this in U.S. and global markets, finding that high-IVOL stocks underperform even after accounting for major risk factors. This contradicts the idea that only systematic risk is rewarded.
Follow-up studies suggest mispricing and arbitrage limits drive this anomaly. Stocks with high IVOL are often hard to short, overpriced, and exhibit characteristics such as small size, low profitability, high investment spending, and growth bias. These traits hinder efficient pricing and contribute to long-term underperformance (Stambaugh et al., 2014; Detzel et al., 2023).
This study extends the literature by examining whether this puzzle holds in Taiwan’s equity market. Using comprehensive, point-in-time data from the TEJ Factor Library, we assess the relationship between IVOL and future stock returns, and evaluate how this factor could be applied in portfolio strategies.
To determine whether the negative return premium associated with Idiosyncratic Volatility (IVOL), observed in the U.S., is also present in Taiwan’s equity market, we conduct an empirical analysis using portfolio sorting techniques. The analysis evaluates IVOL’s predictive power through return statistics, information coefficients, and turnover metrics.
The dataset is sourced from Taiwan Economic Journal (TEJ) :
Sample period: Jan 2005 – Mar 2025
Scope: All listed and OTC common stocks in Taiwan.
IVOL is computed following Hou, Xue, and Zhang (2020):
To ensure reliability:
📍This standardized methodology is implemented across the TEJ Factor Library, which supports systematic factor research and portfolio construction with clean historical signals.
We sort all stocks into 10deciles daily based on their IVOL values and calculate summary statistics over the full sample period.
| Decile | Min | Max | Mean | Std Dev | Count | % of Total |
| 1 | 0.00000 | 0.01707 | 0.00548 | 0.00212 | 746,835 | 10.05% |
| 2 | 0.00424 | 0.01994 | 0.00810 | 0.00234 | 742,751 | 10.00% |
| 3 | 0.00548 | 0.02233 | 0.00999 | 0.00262 | 742,168 | 9.99% |
| 4 | 0.00671 | 0.02471 | 0.01183 | 0.00284 | 742,329 | 9.99% |
| 5 | 0.00792 | 0.02697 | 0.01380 | 0.00300 | 742,907 | 10.00% |
| 6 | 0.00934 | 0.02973 | 0.01600 | 0.00312 | 741,330 | 9.98% |
| 7 | 0.01112 | 0.03211 | 0.01863 | 0.00322 | 741,653 | 9.98% |
| 8 | 0.01357 | 0.03514 | 0.02199 | 0.00332 | 742,271 | 9.99% |
| 9 | 0.01682 | 0.04014 | 0.02666 | 0.00361 | 741,538 | 9.98% |
| 10 | 0.02173 | 1.54585 | 0.03749 | 0.00908 | 744,226 | 10.02% |
📌 Stocks in the top decile exhibit significantly higher IVOL dispersion (Std Dev = 0.00908), indicating greater heterogeneity among high-risk names.
This IVOL breakdown forms the basis for later return and risk analysis.
To better understand how idiosyncratic volatility reflects underlying firm attributes, we examine monthly IVOL decile groups based on end-of-month values. For each decile, we compute the median value of various fundamental indicators.
This analysis reveals distinct patterns linking IVOL levels with valuation, size, liquidity, and institutional participation.
These characteristics align with prior studies describing high-IVOL stocks as small, speculative, and low-quality—ideal candidates for exclusion in portfolio construction.
Table 2: IVOL Deciles and Median Firm Characteristics
(Sample Period: Jan 2005 – Mar 2025; grouped by monthly IVOL rankings)
| Indicator Type | Indicator | Observation |
| Price & Size |
Close Price | Lowest in highest IVOL decile |
| Market CAP | Negatively correlated (higher IVOL = smaller firms) | |
| Amihud Illiquidity | Highest in top IVOL decile; suggests price impact is greater per dollar traded | |
| Valuation & Profit | P/E ratio, P/B ratio | Positively correlated (higher IVOL = higher valuation multiples) |
| Dividend Yield | Negatively correlated (high IVOL = lower cash payouts) | |
| Risk | Total Volatility | Generally increasing with IVOL |
| CAPM_Beta | Positively correlated (high IVOL = higher market sensitivity) | |
| Institutional Holding | Foreign Ownership | Declines in higher IVOL groups, implying lower institutional participation |
| Short Interest | Securities Lending Ratio | Lower in top decile; high-IVOL stocks less shorted by institutions |
| Margin Short Ratio | Positively correlated (high-IVOL stocks more shorted by retail investors) |
📌 Amihud Illiquidity is defined as the average of |daily return| / (daily turnover in million TWD) over the past month.
Securities Lending Ratio and Margin Short Ratio are measured as the daily short balance over market cap.
Figure 1: Median Characteristics by IVOL Decile
(Each subplot displays one variable’s median by decile; X-axis = IVOL deciles ranked monthly)
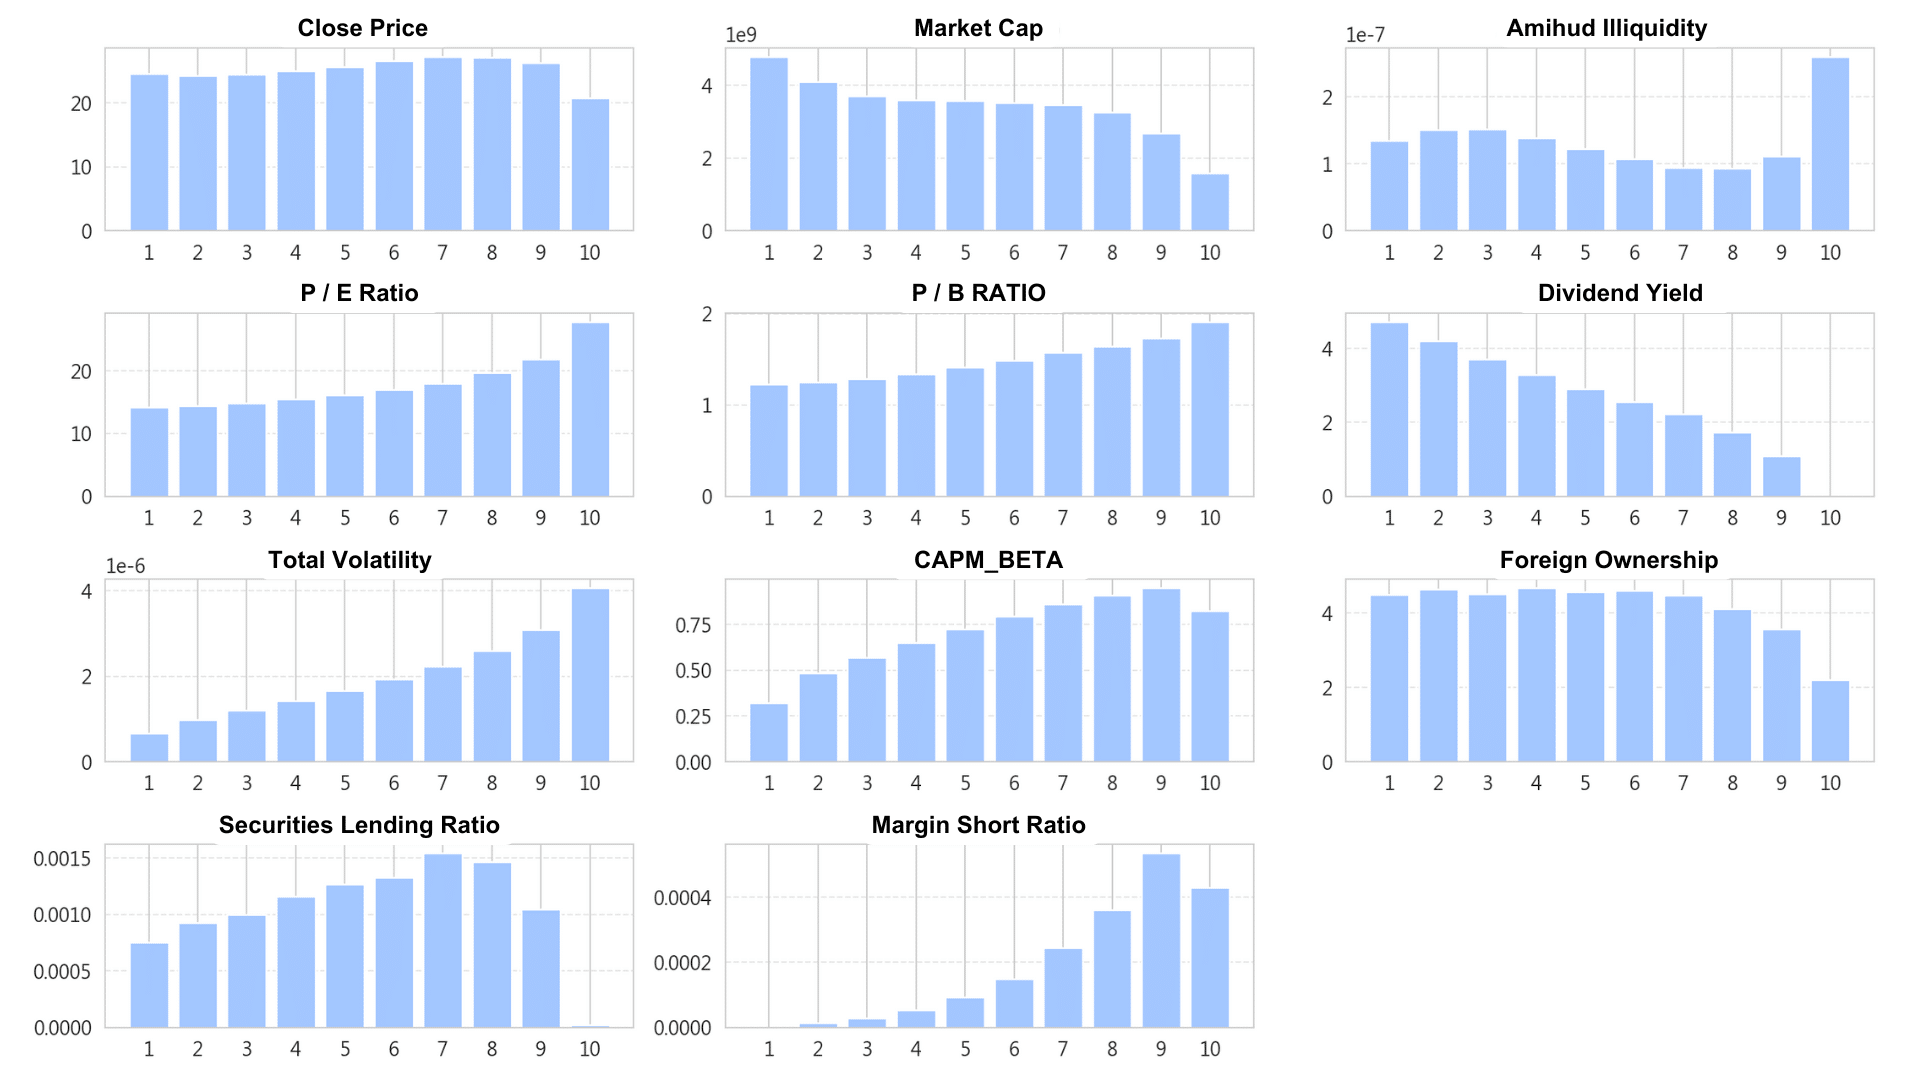
👉 These plots visually reinforce that high-IVOL stocks tend to be small-cap, high-valuation, low-liquidity stocks with minimal institutional support.
Stocks with high IVOL tend to exhibit lower quality fundamentals—they are smaller, more expensive, less liquid, and have weaker institutional confidence. This aligns with the findings of Novy-Marx (2014), who highlighted that high-volatility stocks resemble speculative growth names with poor long-term returns.
From a practical standpoint, screening out the top IVOL deciles could serve as a risk filter, helping to improve overall portfolio quality and consistency.
🧠 Application Note
The TEJ Factor Library enables monthly IVOL rankings and fundamental cross-sectional analysis through a unified point-in-time database—crucial for avoiding survivorship and look-ahead biases in systematic strategies.
To assess IVOL’s effectiveness as a return signal, we analyze the performance of IVOL-based decile portfolios under varying holding periods: 1-day, 5-day, 10-day, and 21-day horizons.
Results show a clear pattern: stocks with lower IVOL consistently outperform those with higher IVOL, regardless of holding period. The return difference between the top (high-IVOL) and bottom (low-IVOL) deciles is negative, indicating the return premium favors low-IVOL stocks.
| Holding Period | Top Quantile (High IVOL) | Bottom Quantile (Low IVOL) | Long-Short Spread (Top – Bottom) |
|---|---|---|---|
| 1 Day (1D) | 6.144 | 7.330 | –1.186 |
| 5 Days (5D) | 4.400 | 6.175 | –2.435 |
| 10 Days (10D) | 4.285 | 5.790 | –2.242 |
| 21 Days (21D) | 4.551 | 5.673 | –2.012 |
The negative spreads indicate that longing low-IVOL stocks while shorting high-IVOL stocks yields a consistent return edge, particularly in short- to medium-term horizons.
Figur2 : Average Return by IVOL Decile – All Holding Periods
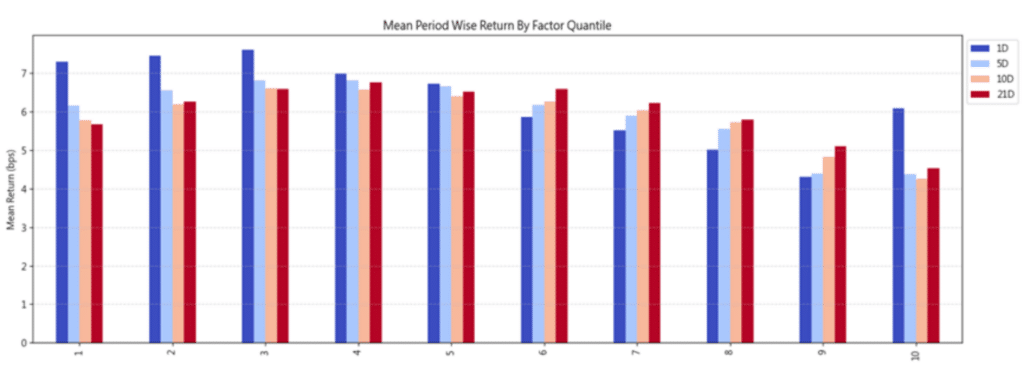
This visual confirms a broadly monotonic decline in average return as IVOL increases, though small deviations exist across middle deciles.
To evaluate long-term performance, we compare the cumulative return trajectories of the lowest and highest IVOL deciles under a 1-day holding strategy.
Figure 3: Cumulative Return Curve of IVOL Deciles (Top vs. Bottom Quantile)
(This figure shows the cumulative returns of the 10th (Top) and 1st (Bottom) IVOL deciles under a 1-day holding period; Sample Period: Jan 2005 – Mar 2025)
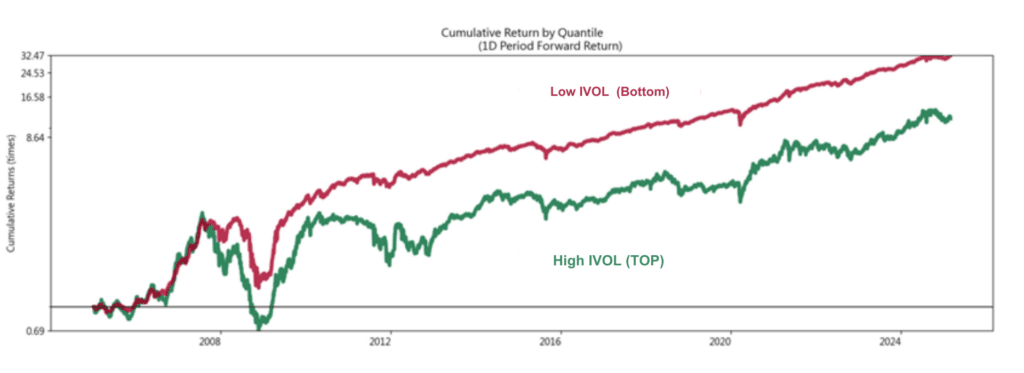
Notably, the low-IVOL portfolio exhibits smoother growth and shallower drawdowns, highlighting its defensive nature, especially during volatile market conditions.
The return analysis suggests that IVOL contains valuable negative predictive power. High-IVOL stocks tend to underperform not just on average, but consistently across different time frames.
This implies IVOL may be better suited as a screening factor—filtering out volatile underperformers—rather than a direct alpha signal for long-only selection.
To further evaluate IVOL’s predictive ability, we calculate the Spearman rank correlation between IVOL values and subsequent stock returns—known as the Information Coefficient (IC).
This approach assesses whether stocks with lower IVOL rankings tend to deliver higher returns, and whether the relationship is statistically consistent over time.
Table 4: Summary Statistics of IVOL Information Coefficients (IC) (Sample Period: Jan 2005 – Mar 2025)
| Metric | 1D | 5D | 10D | 21D |
|---|---|---|---|---|
| IC Mean | -0.0361 | -0.0639 | -0.0754 | -0.0872 |
| IC Std Dev | 0.1315 | 0.1267 | 0.1218 | 0.1225 |
| Risk-Adjusted IC | -0.2745 | -0.5040 | -0.6193 | -0.7121 |
| % IC < 0 | 60.73% | 69.79% | 73.04% | 76.75% |
| % IC < -0.03 | 51.42% | 60.50% | 64.28% | 68.86% |
| % IC < -0.05 | 44.66% | 53.88% | 58.14% | 63.31% |
| IC t-stat | -19.32*** | -35.48*** | -43.59*** | -50.13*** |
| IC p-value | 0 | 0 | 0 | 0 |
| Skewness | -0.0695 | 0.0055 | 0.0326 | 0.1090 |
| Kurtosis | 0.2128 | 0.1033 | 0.1560 | -0.0483 |
To evaluate IVOL’s practicality in real-world portfolio management, we examine the turnover rates of the high- and low-IVOL decile portfolios. Turnover reflects how frequently positions are changed and directly impacts transaction costs and strategy implementability.
Table 5: Average Turnover Rates by Holding Period and IVOL Decile (Sample Period: Jan 2005 – Mar 2025)
| Holding Period | Top Decile (High IVOL) | Bottom Decile (Low IVOL) |
|---|---|---|
| 1 Day (1D) | 0.088 | 0.076 |
| 5 Days (5D) | 0.259 | 0.237 |
| 10 Days (10D) | 0.389 | 0.378 |
| 21 Days (21D) | 0.561 | 0.590 |
While IVOL-based strategies do involve regular position changes, the magnitude is manageable for most institutional portfolios, especially under monthly or biweekly rebalancing.
When applying IVOL as a filter rather than a ranking signal, turnover can be further reduced without compromising risk control benefits.
While Part 1 of this series established the empirical foundations of Idiosyncratic Volatility (IVOL) and its negative return implications in the Taiwan equity market, the next step is turning these into actionable strategies. In Part 2: Factor Strategy – Idiosyncratic Volatility, we move from theory to application—constructing and backtesting both single-factor and filter-enhanced models to evaluate how IVOL can be used to improve portfolio performance.