
Table of Contents
Generally, when a company announces dividend distribution, it signals relative operational stability, indicating sufficient earnings or capital reserves available for distribution . Dividend distribution not only serves to reward shareholders for their long-term support but also publicly conveys the company’s strong performance, potentially enhancing stock price performance.
However, an opposing viewpoint suggests that if a company opts to distribute dividends, it may be perceived by the market as lacking investment opportunities in its core business, thereby choosing to return capital to shareholders, which could imply a potential long-term decline in stock prices.
Therefore, this study utilizes dividend policy information from the TEJ Shareholders’ Meeting Database, applying the event study methodology to analyze whether dividend announcements by listed and over-the-counter (OTC) companies from January 2013 to January 2025 can lead to stock price increases and generate abnormal returns.
Companies make critical decisions affecting their development during shareholders’ meetings. Information disclosed prior to these meetings, particularly details about proposals and resolutions, is crucial for investors interested in participating and understanding the meeting’s content.
The TEJ Shareholders’ Meeting Database integrates pre-meeting information, dividend policies, major resolutions (such as capital increases, capital reductions, and employee stock bonuses), and stock price data at the time of the meeting. The database helps investors quickly understand a company’s development and assess potential investment risks.

The Event Study Methodology is commonly used to analyze whether there are significant Abnormal Returns (AR) in the market’s reaction to a company’s stock before and after a specific event. It also examines whether the Cumulative Abnormal Returns (CAR) remain significantly persistent during the event window. If significant AR and CAR are observed, it can be expected that when a similar event occurs in the future, investors may consider buying the company’s stock to earn positive returns.
A critical aspect of the event study methodology is the estimation of expected returns. Common estimation methods include the Mean Adjusted Model, Market Index Adjusted Model, Ordinary Least Squares (OLS) Estimation, and GARCH Estimation.
In this study, the Market Index Adjusted Model is adopted by using Taiwan Stock Exchange Weighted Return Index (IR0001). The focus is on analyzing whether a company’s stock returns following a specific event exceed the corresponding market index returns, thereby resulting in significant abnormal returns.
After adjusting the individual stock’s daily returns using the market index during the same period, this study defines an event window of 21 trading days before and after the event date to observe changes in abnormal returns around the company’s dividend announcement. Because the board of directors’ decision to distribute dividends is considered significant information, the post-event return (aft_ret) is calculated starting from the first trading day after the event date (t+1).. In principle, the disclosure must occur at least two hours before the start of trading on the next business day following the event. Therefore, investors can only receive the dividend announcement and make corresponding trading decisions on the trading day following the board meeting.
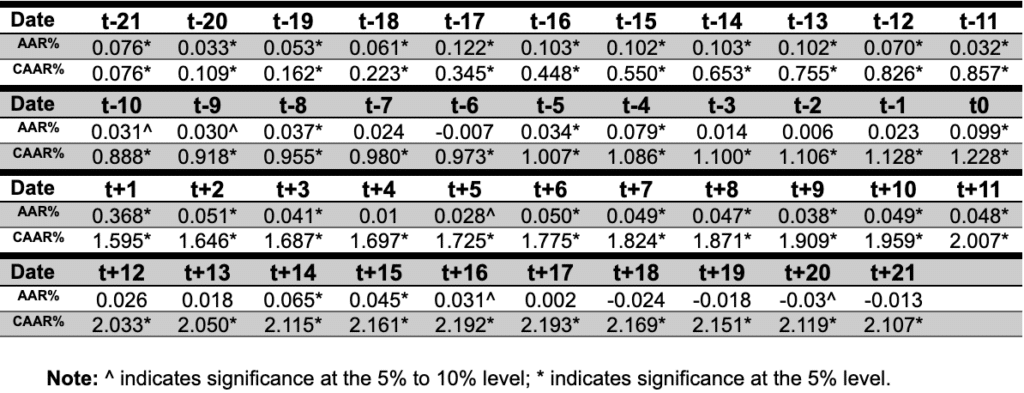
From the figure, it can be observed that in the 21 trading days leading up to the dividend announcement date (t0), the Cumulative Average Abnormal Return (CAAR) increased from 0.076% on t-21 to 1.228% on t0, both reaching significance at the 5% level. The result indicates that the market had already responded before the board meeting, possibly due to expectations of a positive stock reaction following the dividend announcement, prompting investors to buy in advance.
Chart 1, AAR and CAAR around the dividend announcement date ±21 days
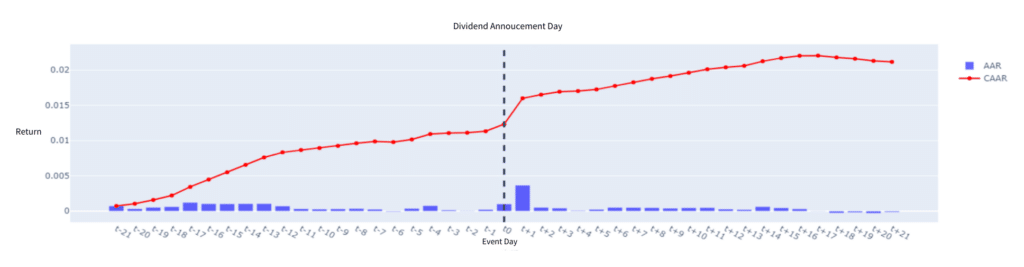
On the first trading day after the dividend announcement (t+1), the market generally showed a positive reaction, with the Average Abnormal Return (AAR) at 0.368% and the CAAR reaching 1.595%, both significant at the 5% level. Furthermore, positive AARs persisted until t+17, with the CAAR peaking at 2.193%. Subsequently, the AARs gradually turned negative, suggesting that the market took approximately three weeks to fully absorb and react to the dividend announcement.
Table 1, Traditional, Electronic, and Financial Industry AAR & CAAR during the window
We further categorized Taiwan’s listed companies into traditional, electronics, and financial industries to observe whether the effects of dividend announcements vary across different sectors.
From the figure, it is evident that the effects of dividend announcements differ across the three sectors. Traditional and electronics industries exhibit similar patterns, with stock prices reacting as early as 21 trading days before the dividend announcement. The Average Abnormal Returns (AAR) were generally positive, driving a steady increase in the Cumulative Average Abnormal Return (CAAR), indicating that the market was optimistic and investors took early positions.
The financial industry, however, showed a distinct pattern. From t-21 to t-5, the AAR was highly volatile, with the overall CAAR slightly decreasing from -0.085% to -0.26%, which contrasts with the other two industries. However, after t-5, a series of positive AARs emerged, pulling the CAAR back into positive territory at 0.030%. The result suggests that the market generally waited until about a week before the board meeting to take positions in anticipation of dividend announcements by financial companies.
On the first trading day after the dividend announcement (t+1), the AARs for the traditional and electronics industries were relatively similar at 0.302% and 0.417%, respectively. In contrast, the financial industry’s AAR was significantly higher at 0.610%, nearly double that of the traditional industry. This surge drove the CAAR to 0.640%, reaching the 5% significance level, indicating that investors actively bought into financial stocks, pushing prices above the corresponding market index.
From t+2 to t+21 after the announcement date, it can be observed that the traditional and electronics industries generally continued a steady upward trend, with their CAARs reaching 1.792% and 2.511%, respectively, both significant at the 5% level. In contrast, the financial industry showed a relatively sluggish performance, with the CAAR declining to 0.661% within the first week (t+5) after the announcement and only slightly increasing to 0.739% in the subsequent period.
This suggests that the market’s reaction to the stocks of traditional and electronics companies was slower but more positive, with sustained positive AARs even after the announcement date. However, the market reacted more swiftly to financial industry stocks, possibly due to better information transparency in the financial sector, making price reactions more immediate and reducing the likelihood of underreactions.
Chart 2, AAR and CAAR around the dividend announcement date ±21 days in the three industries
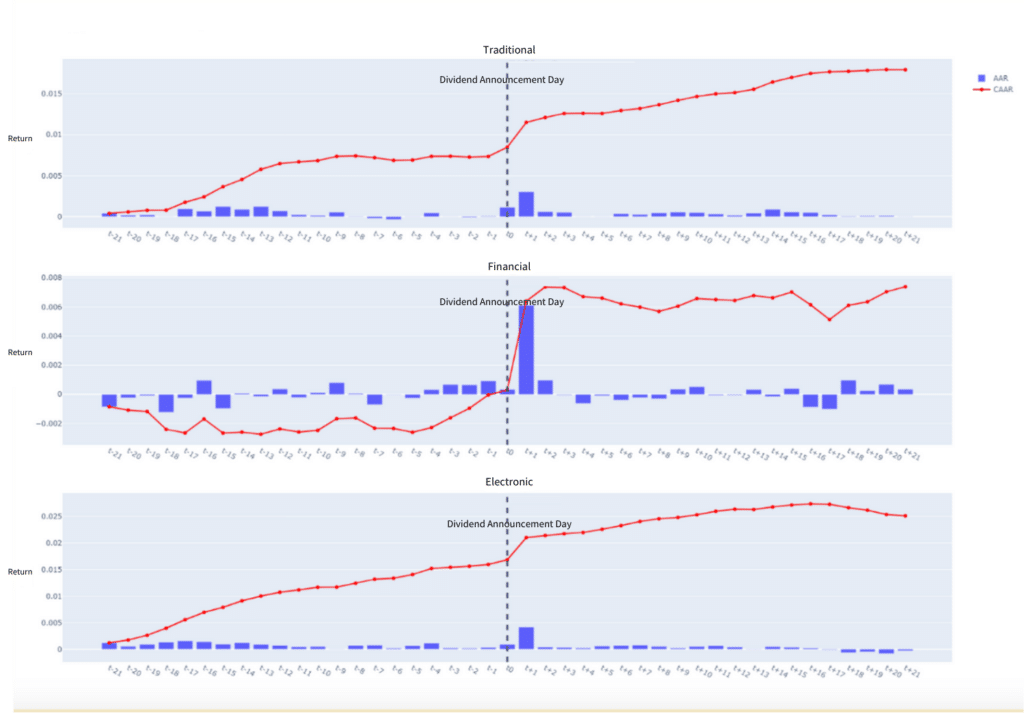
Table 2, AAR and CAAR around the dividend announcement date ±21 days in the three industries
| CAAR% | t-21~t0 | t-21~t+1 | t-21~t+21 |
| Traditional | 0.848* | 1.150* | 1.792* |
| Financial | 0.030 | 0.640* | 0.739* |
| Electronics | 1.686* | 2.103* | 2.511* |
In addition to categorizing by industry, analysis can also be conducted based on changes in the latest dividend amounts compared to the previous period, to observe whether increases, decreases, or unchanged dividends convey different information.
With the implementation of the new regulation under Article 228-1 of the Company Act on November 1, 2018, companies are allowed to distribute dividends multiple times within a year. The regulation specifies that the distribution of earnings or the offsetting of losses may be conducted after the end of each quarter or semi-annual accounting period. TSMC (2330) adopted quarterly distributions starting in 2019. Therefore, when calculating, it is necessary to categorize dividend data by distribution frequency (annual, semi-annual, and quarterly) based on the dividend distribution type. This approach avoids mistakenly interpreting a shift from annual to quarterly distribution as a reduction in dividend payouts.

From the figure, it can be observed that for the dividend reduction samples, although there were still positive Average Abnormal Returns (AAR) from t-21 to t-12, driving the Cumulative Average Abnormal Return (CAAR) to a peak of 0.437%, it subsequently declined rapidly. On the dividend announcement date (t+1), AAR dropped to -0.231%, pulling CAAR from a slightly positive 0.055% down to -0.176%. Within the following week (t+1 to t+6), CAAR fell further to its lowest point of -0.557%. This indicates that the market was able to react about two weeks in advance to anticipated dividend reductions, leading to a series of negative AARs prior to the announcement and significant sell-offs within a week after the announcement.
In contrast, for the dividend increase samples, there were consistently positive AARs from t-21 to t0, with CAAR reaching 2.237%, significant at the 5% level even before the announcement. On t+1, AAR sharply increased to 0.867%, pushing CAAR up to 3.104%. From t+2 to t+21, CAAR continued to rise, eventually reaching 4.448%, also significant at the 5% level. This suggests that the market had already anticipated strong business performance and sufficient cash flows to maintain or even increase dividends, which drove stock prices to continue rising, resulting in a sustained and gradual increase in CAAR within one month after the announcement.
Finally, for the unchanged dividend samples, CAAR was only an insignificant 0.269% from t-21 to t0, primarily due to fluctuating AARs during this period. This reflects the market’s uncertainty regarding the company’s ability to maintain existing dividend payouts. However, on t+1, the market responded positively to the confirmation of maintained dividends, with AAR rising to 0.170%, pushing CAAR up to 0.439%, significant at the 5% level. Over the following month, although AARs remained volatile, CAAR slowly increased, eventually reaching 0.840%, also significant at the 5% level.
Chart 3, AAR and CAAR on the dividend announcement date under different dividend policies.
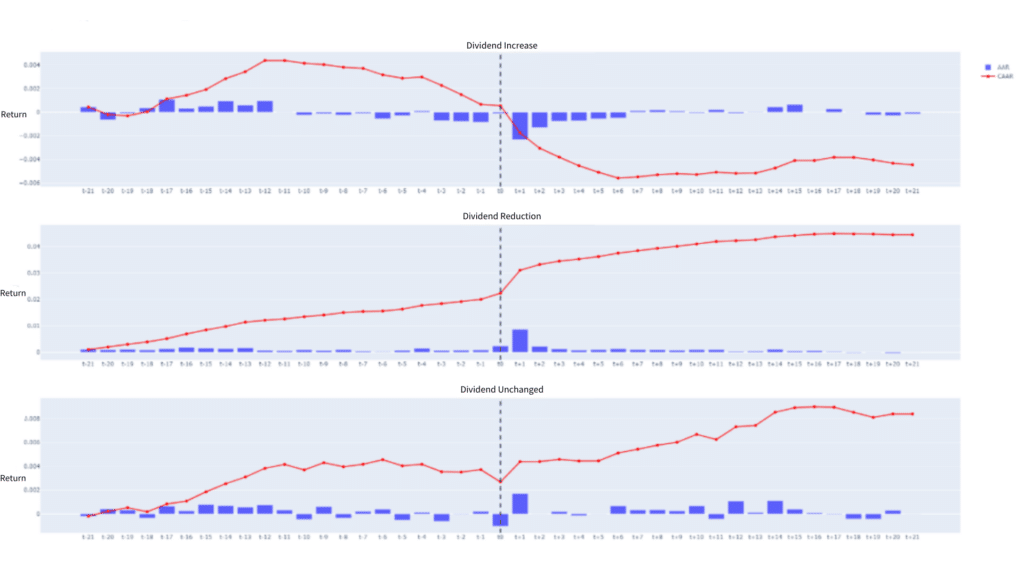
Table 3, AAR and CAAR on the dividend announcement date under different dividend policies.
| CAAR% | t-21~t0 | t-21~t+1 | t-21~t+21 |
| Dividend Reduction | 0.055 | -0.176 | -0.445* |
| Dividend Increase | 2.237* | 3.104* | 4.448* |
| Dividend Unchanged | 0.269 | 0.439* | 0.840* |
Overall, stocks exhibited a significant average abnormal return (AAR) of 0.368% on the day following the dividend announcement, generating returns superior to the corresponding market index. Among industries, the financial sector recorded the highest AAR (0.610%), followed by the electronics sector (0.417%) and the traditional sector (0.302%). However, the sustainability of abnormal returns in the financial sector was relatively weak, possibly due to the market’s more comprehensive access to information, resulting in less underreaction in stock prices. In contrast, the electronics and traditional sectors, which include a greater number of small and medium-sized companies, may suffer from less market transparency. This information asymmetry could explain the gradual increase in stock prices after the event as the market slowly absorbs the information.
When analyzing based on changes in dividend amounts compared to the previous period, companies that increased dividends showed a more significant AAR of 0.867% on the day following the announcement. Conversely, companies that reduced dividends experienced a negative AAR of -0.231%, while companies with unchanged dividends exhibited an insignificant AAR of 0.170%.
Important Reminder: This analysis is for reference only and does not constitute any product or investment advice.
We welcome readers interested in various trading strategies to consider purchasing relevant solutions from Quantitative Finance Solution. With our high-quality databases, you can construct a trading strategy that suits your needs.
“Taiwan stock market data, TEJ collect it all.”
The characteristics of the Taiwan stock market differ from those of other European and American markets. Especially in the first quarter of 2024, with the Taiwan Stock Exchange reaching a new high of 20,000 points due to the rise in TSMC’s stock price, global institutional investors are paying more attention to the performance of the Taiwan stock market.
Taiwan Economical Journal (TEJ), a financial database established in Taiwan for over 30 years, serves local financial institutions and academic institutions, and has long-term cooperation with internationally renowned data providers, providing high-quality financial data for five financial markets in Asia.
With TEJ’s assistance, you can access relevant information about major stock markets in Asia, such as securities market, financials data, enterprise operations, board of directors, sustainability data, etc., providing investors with timely and high-quality content. Additionally, TEJ offers advisory services to help solve problems in theoretical practice and financial management!
The TEJ Shareholder Meeting Database and Dividend Policy Database provide comprehensive information on the historical shareholder meetings and dividend policies of Taiwan’s listed companies. These resources help investors understand corporate long-term business strategies and capital allocation models. By analyzing shareholder meetings and dividend policy information, you can:
Visit the TEJ Data Bank now to explore more about TEJ’s professional financial databases!
