
Table of Contents
Over the past decades, quantitative investing has evolved from academic theory into a core pillar of modern investment management. Foundational models such as CAPM, APT, and the Fama-French multifactor framework have shaped how investors identify and quantify systematic return drivers—known as factors. These factors have since been embedded into institutional workflows, powering everything from alpha generation to portfolio construction and risk management.
However, the proliferation of factors—often inconsistently defined or statistically fragile—has given rise to what researchers call the “factor zoo.” This phenomenon underscores the urgent need for structured, high-quality data and disciplined implementation frameworks.
TEJ’s Factor Library was created in response to these challenges. It offers a robust, point-in-time (PIT) database featuring more than 100 academically grounded and locally adapted factors across 11 core categories. Built for practical deployment in the Taiwan stock market, the library empowers investors to accelerate research, build repeatable quantitative strategies, and generate more reliable alpha signals through transparent and consistent data.
Yet even with a well-structured foundation, factor investing remains a complex discipline—especially when moving from theory to execution.
The factor investing process—from data collection to strategy construction—is complex and resource-intensive (see Figure 1). Analysts must source data from multiple providers or crawlers, deal with inconsistent formats, and often face the lack of a point-in-time (PIT) structure—introducing risks like look-ahead bias.
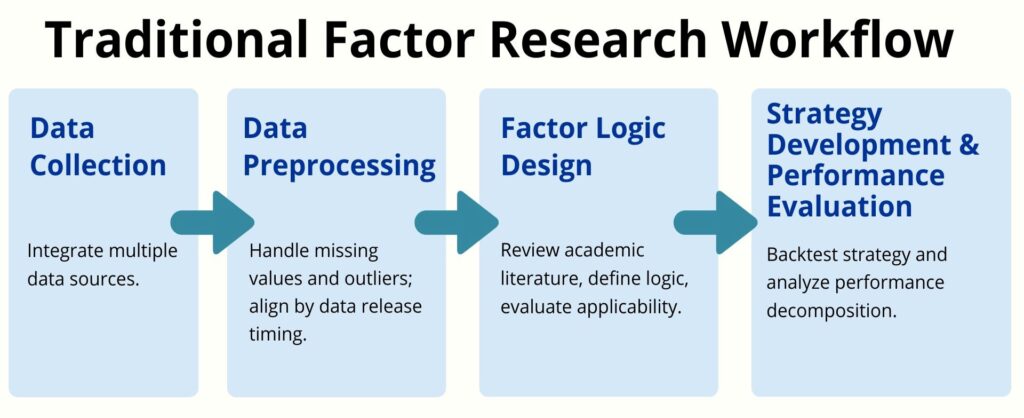
Figure1:Traditional Factor Research Workflow
Preprocessing involves missing value handling, outlier detection, and aligning data by release timing—all technically demanding tasks. Designing factor logic requires extensive literature review, adapting definitions for local markets, and ensuring statistical validity. These challenges consume significant time and resources and introduce errors that can hinder research and replication.
A well-structured factor database that incorporates PIT processing, academic rigor, and transparent methodology can greatly streamline the process and help investors focus on strategy innovation.
TEJ’s Factor Library is a structured, point-in-time database designed to explain asset risks and returns through factor characteristics. It currently covers 11 major factor categories: Momentum, Dividend Yield, Value, Growth, Quality, Liquidity, Volatility, Size, Sentiment, Credit Risk and machine Learning. All data are processed with complete PIT alignment and traceability to eliminate forward-looking bias.
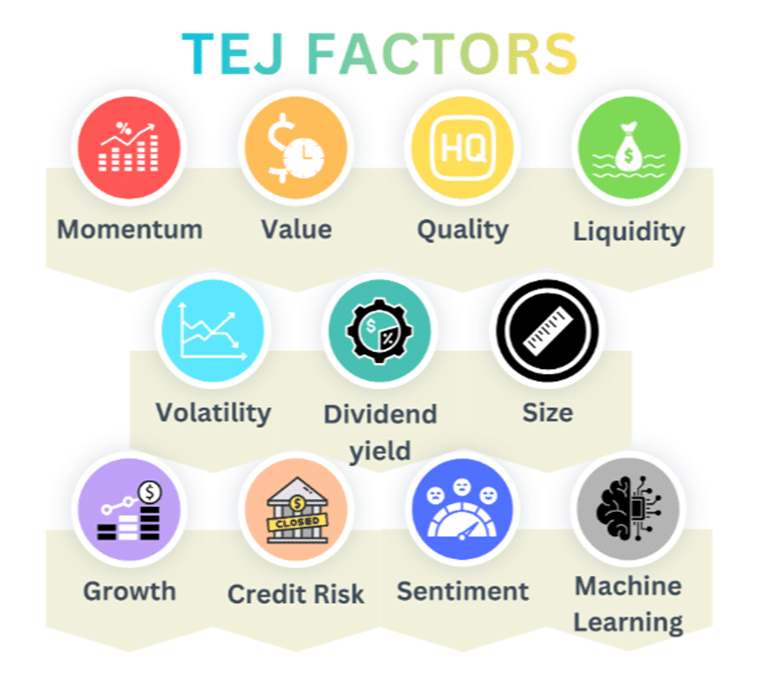
Figure 2:TEJ Factor Library -11 Factor Categories
| Category | Description |
|---|---|
| Momentum | Captures the persistence in both price and fundamental performance of a firm. |
| Dividend Yield | Captures the excess returns associated with high-dividend stocks and reflects a firm’s dividend policy and capital return strategy. |
| Value | Reflects undervaluation relative to fundamentals and potential for excess returns. |
| Growth | Reflects the growth potential of a company’s earnings and revenues, and captures excess returns from high-growth stocks. |
| Quality | Reflects a company’s financial strength and operational soundness, and captures excess returns from high-quality stocks. |
| Liquidity | The liquidity factor measures trading ease. Stocks with lower liquidity often entail higher costs, leading to potential excess returns. |
| Volatility | Measures the uncertainty in stock prices or returns, and captures the excess returns associated with low-risk stocks (as measured by volatility, beta, or idiosyncratic risk). |
| Size | Captures the relationship between a firm’s market capitalization and its returns. |
| Sentiment | Captures the impact of investor behavior and psychological expectations on stock prices. |
| Credit Risk | Measures the probability of corporate default or bankruptcy. |
| Machine Learning | Utilizes statistical algorithms and AI techniques to extract non-linear features and complex patterns from high-dimensional data, aiming to enhance asset pricing or return prediction accuracy. |
The value of the Factor Library extends beyond data provision—it enables diverse applications across the investment lifecycle. Depending on the strategy, investors can deploy single or multiple factors for stock selection, risk assessment, and model construction.
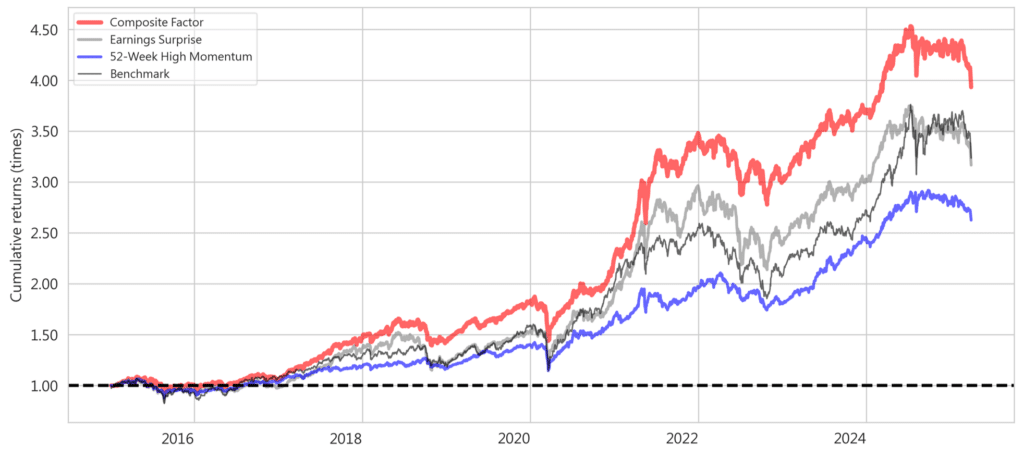
Figure 3: Cumulative Return of a Factor Strategy – highlighting how factor data supports performance backtesting to discover alpha-generating strategies.
In today’s market environment—characterized by an explosion of factors and widening information gaps—researchers often find themselves bogged down by labor-intensive processes such as data preparation, validation, and ongoing maintenance. These challenges make it difficult to focus on strategic optimization and backtesting. The TEJ Factor Library was explicitly designed to solve these pain points. Its data service emphasizes academic rigor, practical relevance, and completeness in update frequency, data structure, and usability. It also serves as a high-quality market data service that facilitates advanced quantitative data analysis.
Factors are specifically designed for the Taiwan market, incorporating local trading behaviors such as margin financing, broker activity, and institutional flows, enabling the capture of market microstructure and behavioral patterns often missing in global datasets, and allowing investors to identify Taiwan-specific inefficiencies and generate more differentiated alpha signals.
All factors are constructed under a strict Point-in-Time framework, preserving historical data versions and aligning with actual data availability, ensuring the elimination of look-ahead bias and consistency between backtesting and live trading environments, thereby improving the reliability and credibility of research results and reducing model risk in investment decision-making.
The dataset provides 116 pre-calculated factors across 11 categories in a standardized, research-ready format, removing the need for data cleaning, factor construction, and alignment across multiple sources, and enabling researchers to focus on alpha generation rather than data engineering while significantly accelerating the overall research process.
| Factor Code | mom52wh |
| Factor Name | Momentum Factor (52-Week High) |
| English Name | 52-Week High Momentum (MOM52WH) |
| Category | Momentum |
| Subcategory | Price Momentum |
| Expected Direction | Positive |
| Reference | George, T.J., & Hwang, C. (2004). The 52-Week High and Momentum Investing. Journal of Finance, 59(5), 2145–2176. |
| Calculation Method | Adjusted closing price of the day divided by the highest adjusted price over the past 252 trading days. |
TEJ’s Factor Library empowers investment teams with high-quality, standardized, and traceable factor data, bridging the gap from data acquisition to live strategy execution. It’s not just a research tool, but a strategic asset—enabling alpha discovery, model backtesting, and risk management.
By combining academic insights with local market practices, and supporting over 100 factors across 11 categories with PIT structure and daily updates, TEJ provides the robust infrastructure required to navigate the expanding world of factor investing. In an era of market uncertainty and data explosion, only those with access to verifiable and flexible factor systems can stay ahead in the quant investing landscape.
TEJ’s commitment to innovation, accuracy, and usability positions the Factor Library as an indispensable resource for investors aiming to transform data into performance.