Table of Contents
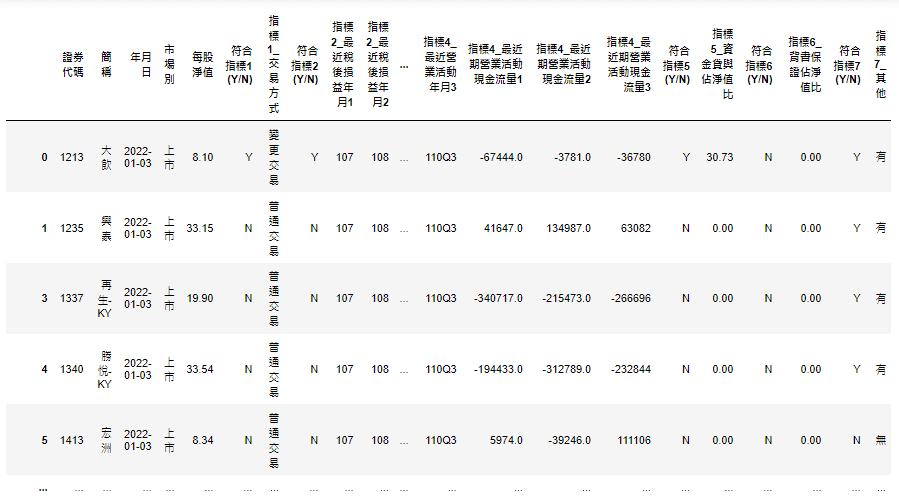
The “Financial Focus Section” was established by the Stock Exchange in 2007 with the aim of highlighting the operational risks of companies. It lists 9 indicators for investors to quickly assess the financial and operational status of companies, thereby excluding those with poor financial health. Starting in 2022, the Stock Exchange renamed the former “Financial Focus Section” to “Financial and Trading Information Focus Section” and divided the original 9 financial indicators into 7 financial information indicators and 5 trading information indicators. This article will utilize the Stock Exchange’s provided 7 financial information indicators and explore their correlation with stock price counter-indicators using the TEJ API. The financial information indicators are as follows:
For details, please refer to: 公開資訊觀測站 – 財務資訊重點專區
This article uses Windows and Jupyter as the editor.
import tejapi
import pandas as pd

tejapi.ApiConfig.api_key  = "Your Key"
tejapi.ApiConfig.api_base = "https://api.tej.com.tw"
tejapi.ApiConfig.ignoretz = True
Import the Financial Information Focus Section table and select dates and listed companies.

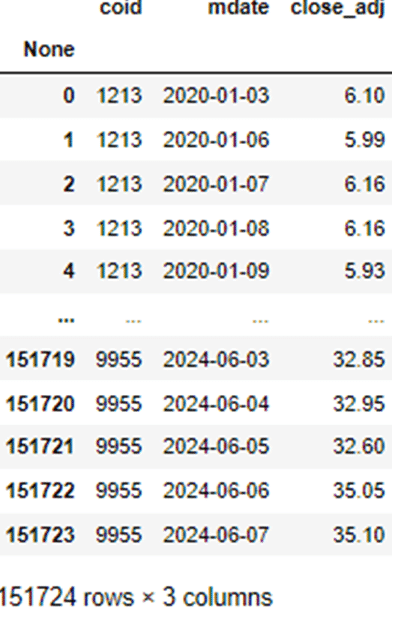
Import TEJ API Database
data = tejapi.get('TWN/APRCD1',
coid = pool,
mdate = {'gte':'2020-01-03', 'lte':'2024-06-07'},
opts = {'columns':['coid', 'mdate', 'close_adj']},
paginate = True,
)
data
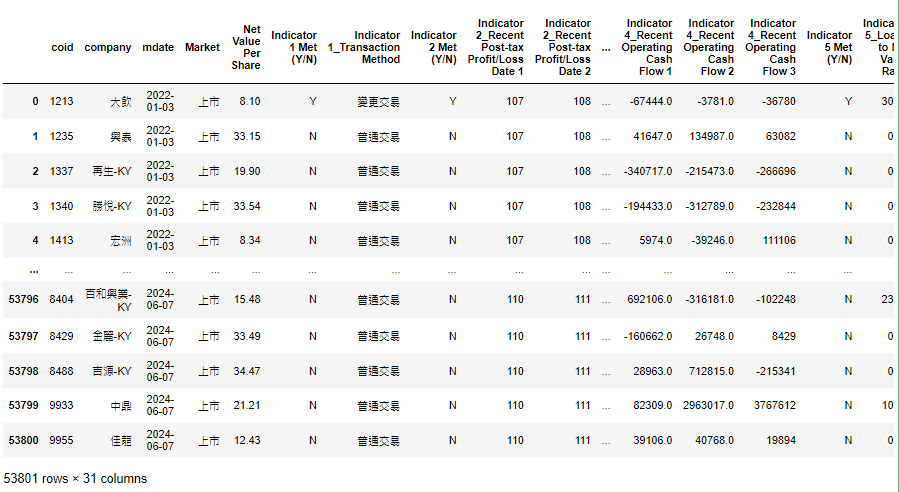
Combine the Financial Information Focus Section Table and the Ex-Dividend and Ex-Rights Adjustment Table.

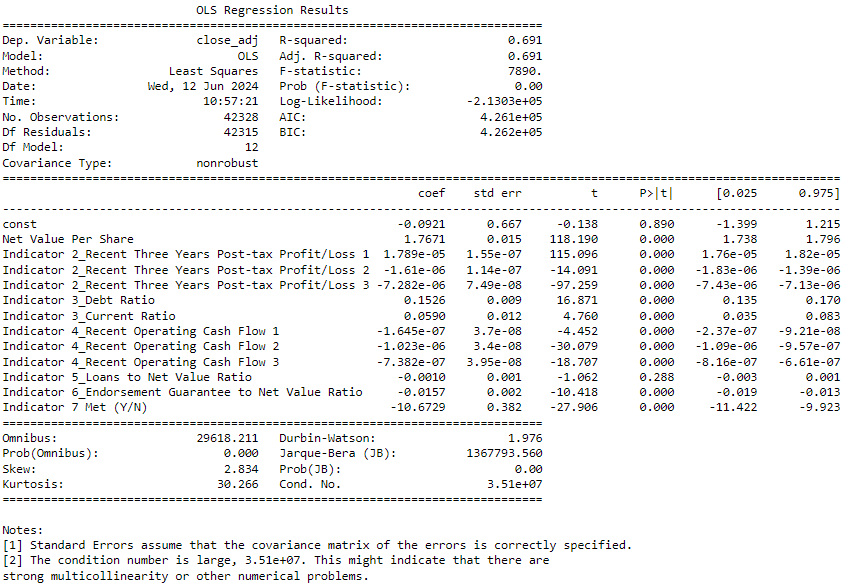
Using net asset value per share, net profit after tax for the last three years, current ratio and debt ratio, operating cash flow for the last three years, the ratio of loans to others to net asset value, the ratio of endorsement guarantees to net asset value, and any other factors deemed necessary by the Taiwan Stock Exchange as independent variables, create a regression model with adjusted closing price as the dependent variable.

According to the chart above, the R-squared value reaches 0.691, indicating that the model can explain nearly 69% of the variance in the dependent variable. It was observed that the indicators “ratio of endorsement guarantees to net asset value” and “other factors considered by the Taiwan Stock Exchange” exhibit a significant inverse relationship with stock prices. Particularly noteworthy is the latter indicator, which, despite being binary in nature (either it occurs or not), exerts a substantial impact on stock prices when it does occur. This underscores investors’ sensitivity to regulatory considerations. Additionally, a higher ratio of endorsement guarantees to net asset value suggests that the company has provided guarantees far exceeding its net worth, indicating significant liabilities. If these guarantees are executed, the company may need to pay substantial amounts, affecting investor confidence in the company’s prospects.
From our analysis of the Financial Information Focus Section table and individual stock prices, we found that the “ratio of endorsement guarantees to net asset value” and “other factors considered by the Taiwan Stock Exchange” exhibit significant counter-indicator trends for company stock prices compared to other indicators. The regulatory considerations by the authorities are particularly crucial to investors. On the other hand, the “price-to-book ratio” shows a noticeable positive correlation with stock prices. However, the effects of other indicators on stock prices are insignificant. Overall, the OLS regression model provides an in-depth analysis of the factors affecting stock prices. These findings offer valuable insights for investors evaluating company investment decisions.
This implementation utilized the TEJ API for key stock price counter-indicator analysis, leveraging the efficient data from the TEJ Data Bank and regression model packages. This approach not only saves time and effort but also provides investors with a diverse set of evaluation metrics. Choosing relevant solutions from the TEJ Market Data allows for the construction of tailored analyses or trading strategies using high-quality databases.
Reminder: The strategy is only for reference and does not represent recommendations or advice on financial products and investments.
About us