
Table of Contents
In Taiwan ,our investor have the higher preference for the high yield stock,and high-yield stocks tend to be accompanied by low volatility,that we call low Beta.
The Beta value represent the correlation with the broader market,0050
is well known in Taiwan ,and the beta is between about one ,It shows that he can reflect the ups and downs of the broader market.0056 beta is between 0.75~1 ,which shows that is degree of volatility lower than 0050 .
Recently,uncertainty in the stock market due to geopolitics and interest rate hikes,which cause the high volatitlty.The best way for ordinary investors is to reduce hold part, according to ,but according to Fidelity’s research report an American investor misses the best 50 days of return in the past 40 years, your assets will be a full 93% less than that of an investor who stays in the market completely, so perhaps choosing a lower risk stock is a good alternative plan.
In recent month 0050 down about 4% ,but 0056 up 1% . during turbulent times, is it safer to choose high-yield stocks? Therefore, this article wants to analyze the dividend payout status of high-yield stocks in the past five years to see if it is appropriate to use beta indicators to choose high-yield stocks recovery ex -dividend.
In this article , we use three indicators to classify
Window10 Spyder(anaconda31)
Security Transaction Data Table:Listed securities with unadjusted price and index. Code is ‘TWN/EWPRCD’
Share Price Compensation (Day) — BETA: The database code is (TWN/ABETA)
Security Attribute Data: The database code is (TWN/AIND)
Listed (cabinet) recovery ex-diviend database: the database code is TWN/AREINT
import pandas as pd
import matplotlib.pyplot as plt
import numpy as np
#################TEJ
import tejapi
tejapi.ApiConfig.api_key = 'Your Key'
tejapi.ApiConfig.ignoretz = True
data=tejapi.get('TWN/EWNPRCSTD' ,chinese_column_name=True )
select=data["上市別"].unique()select=select[1:3]
condition =(data["上市別"].isin(select)) & ( data["證券種類名稱"]=="普通股" )
data=data[condition]
twid=data["證券碼"].to_list()
get the all id of the listed company
year='2017' ######選擇年度 本年度選擇2017~2021
start= year+'-01-01'
end = year+"-12-31"
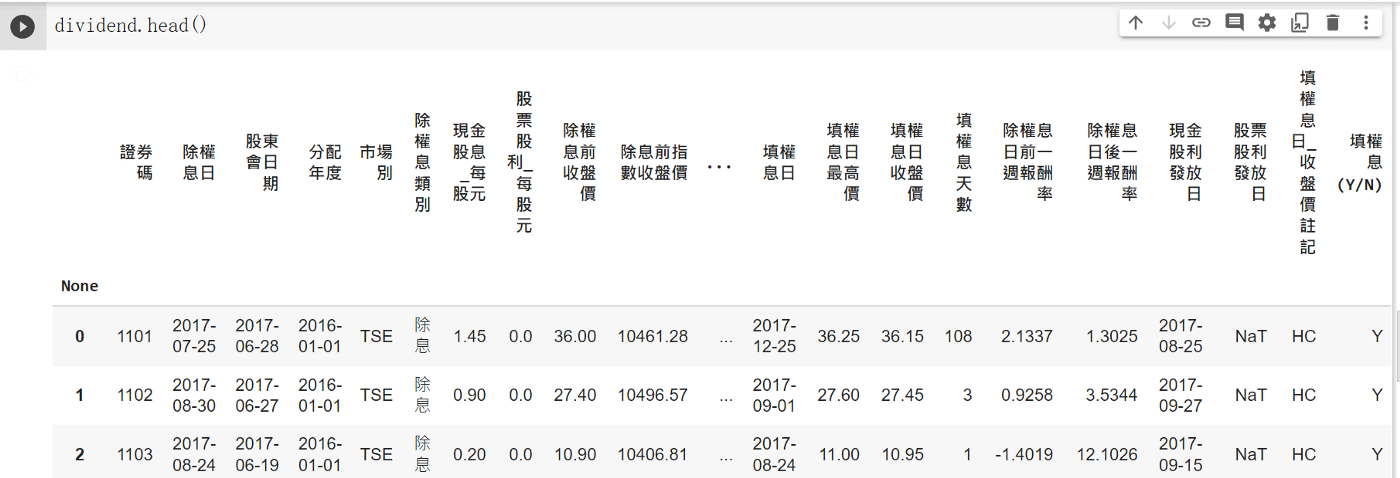
dividend=tejapi.get('TWN/AREINT' ,
coid=twid,
mdate={'gt':start,'lt':end},
paginate=True,
chinese_column_name=True)
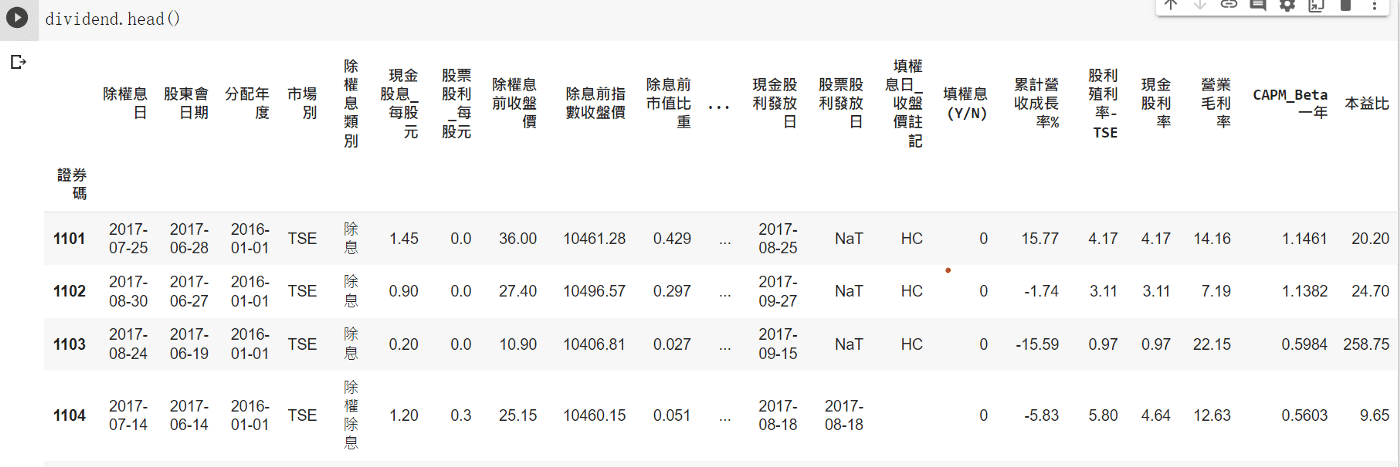
check dividend
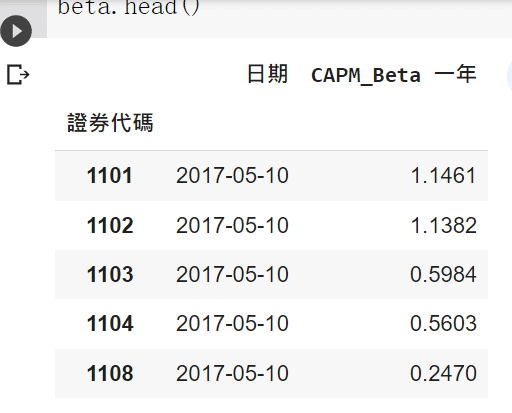
Next, we need the beta value and select it from the database, and our data are selected from a trading day that falls around 5/10 (announced April revenue), most companies have announced dividends, and the first quarter financial reports are all out (the deadline is also 3/31).
start= year+'-05-09'
end=   year+"-05-11"
opts={'columns': ['coid','mdate', 'beta_1y']}
beta = tejapi.get('TWN/ABETA',
                  coid=twid,
            mdate={'gt':start,'lt':end},
            paginate=True,
            chinese_column_name=True
)
beta.set_index("證券代碼",inplace=True) #方便合併
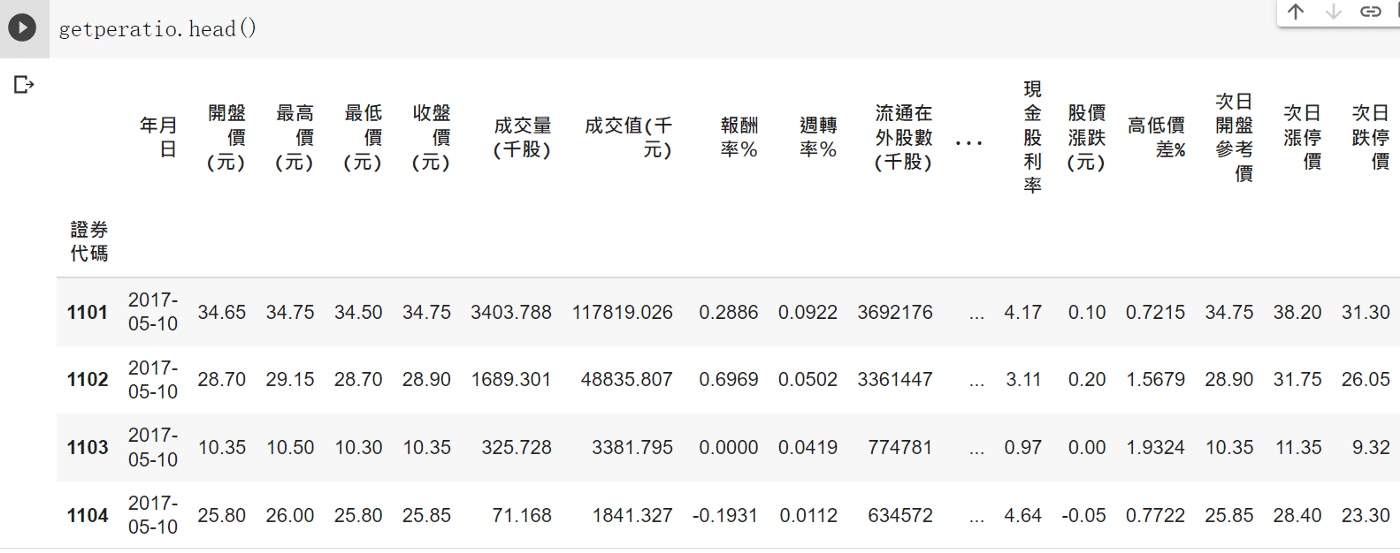
We are going to get the pe-ratio,yield .
start= year+'-05-9'
end=   year+"-05-11"
getperatio=tejapi.get('TWN/APRCD' ,
                  coid=twid,
                  mdate={'gt':start,'lt':end},
                  paginate=True,
                  chinese_column_name=True )
getperatio.set_index("證券代碼",inplace=True)
Get the grossgross profit margin
twid1=twid
groups = []
while True:
    if len(twid1) >= 50:
        groups.append(twid1[:50])
        twid1 = twid1[50:]
    elif 0 <= len(twid1) < 50:
        groups.append(twid1)
        break
Use the loop to get the financial report .(avoid api reject it)
fin_data = pd.DataFrame()start=year+'-01-01'
end=  year+"-03-22"    ##first
for group in groups:
    fin_data = fin_data.append(tejapi.get('TWN/EWIFINQ',
                  coid = group,
                  mdate={'gt':start,'lt':end},

                  chinese_column_name = True,
                  paginate = True)).reset_index(drop=True)
fin_data.set_index("證券碼",inplace=True)
We get the first quarter finanical report , and we want month revenue next !
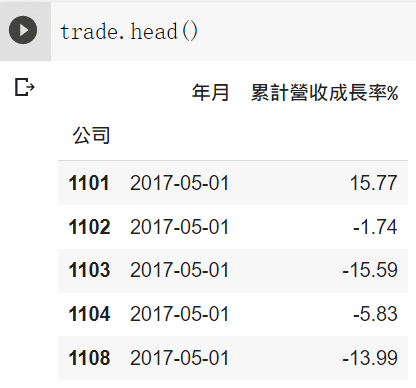
Finally we get all we want! ,we should combine all the data together by “id”
dividend["累計營收成長率%"]=trade["累計營收成長率%"]
dividend["股利殖利率-TSE"]=getperatio["股利殖利率-TSE" ]
dividend["現金股利率"]=getperatio["現金股利率" ]
dividend["營業毛利率"]=fin_data["營業毛利率"]
dividend["CAPM_Beta 一年"]=beta['CAPM_Beta 一年']
dividend["填權息(Y/N)"]=dividend["填權息(Y/N)"].apply(lambda x : 1 if x == "Y" else 0)  ###將y n變成0 或 1
dividend["填權息(Y/N)"].value_counts()
dividend["本益比"]=getperatio["本益比-TSE" ]
Next step is start to analyze the data , so we write a function to get recovry
probability.
def count(x):
   a,b =  x["填權息(Y/N)"].value_counts()
   c=x["填權息天數"].mean()
   return f'填息機率 : {a/(a+b)}' , f'填息家數 : {a}' ,f'未填息家數 : {b}', f'填息天數 : {c}'###算出資料及裡面填權息天數 與機率
div5=dividend[dividend["股利殖利率-TSE"]>5]
count(div5)
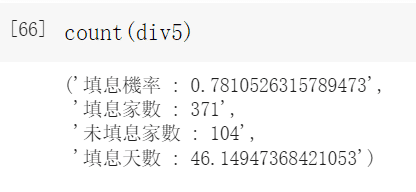
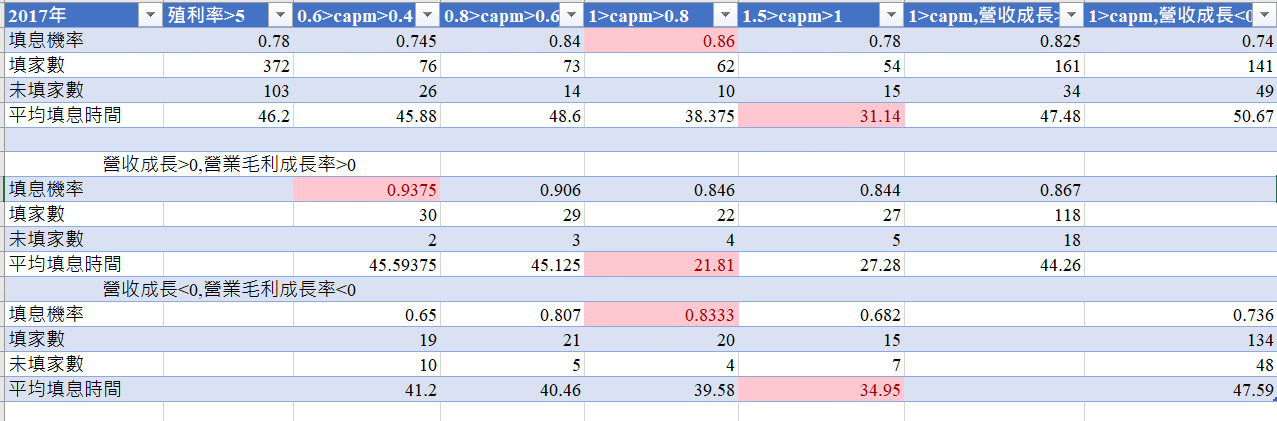
In 2017 ,the recovry probability is 78% and the average days was 46.
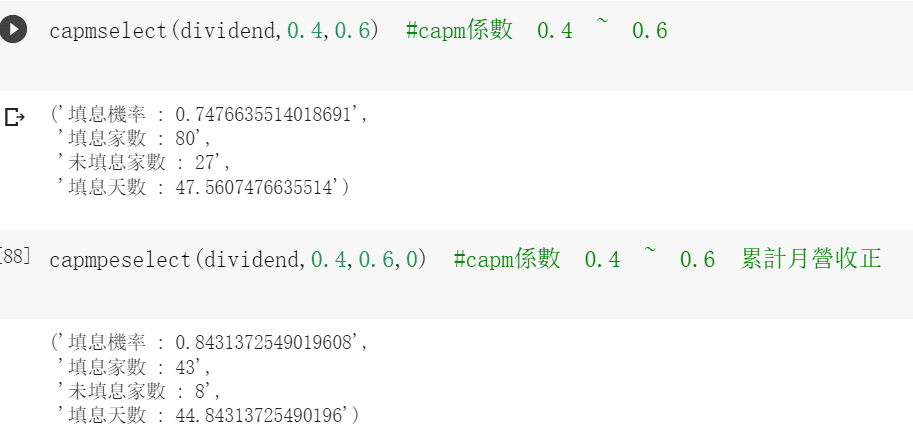
def capmselect(df,b,c):
    yy=df[(df["股利殖利率-TSE"]>5)&(df["CAPM_Beta 一年"]>b)&(df["CAPM_Beta 一年"] < c)]
    return count(yy)def capmpeselect(df,b,c,d ):   ########條件增加月營收的yy=df[(df["股利殖利率-TSE"]>5)&(df["CAPM_Beta 一年"]>b)&(df["CAPM_Beta 一年"] < c)& (df["累計營收成長率%"] > d )]
    return count(yy)def ncapmpeselect(df,b,c,d ):  #####累計成長負的yy=df[(df["股利殖利率-TSE"]>5)&(df["CAPM_Beta 一年"]>b)&(df["CAPM_Beta 一年"] < c)& (df["累計營收成長率%"] < d )]
    return count(yy)def allcondition(a,b,c,d,e,f):  #累計營收正 毛利率成長正  allcondition=dividend[(dividend["股利殖利率-TSE"]>a)&(dividend["本益比"]<b)&(dividend["CAPM_Beta 一年"]>c)&
(dividend["CAPM_Beta 一年"]<d)&
(dividend["累計營收成長率%"]>e)&
(dividend["營業毛利成長率"]>f)]
    return count(allcondition)def nallcondition(a,b,c,d,e,f): #累計營收負 毛利率成長負  allcondition=dividend[(dividend["股利殖利率-TSE"]>a)&(dividend["CAPM_Beta 一年"]>c)&(dividend["CAPM_Beta 一年"]<d)&(dividend["累計營收成長率%"]< e)&(dividend["營業毛利成長率"]<f)]  return count(allcondition)
We use the Beta among 0.4 to 0.6 to demonstrate our outcome !
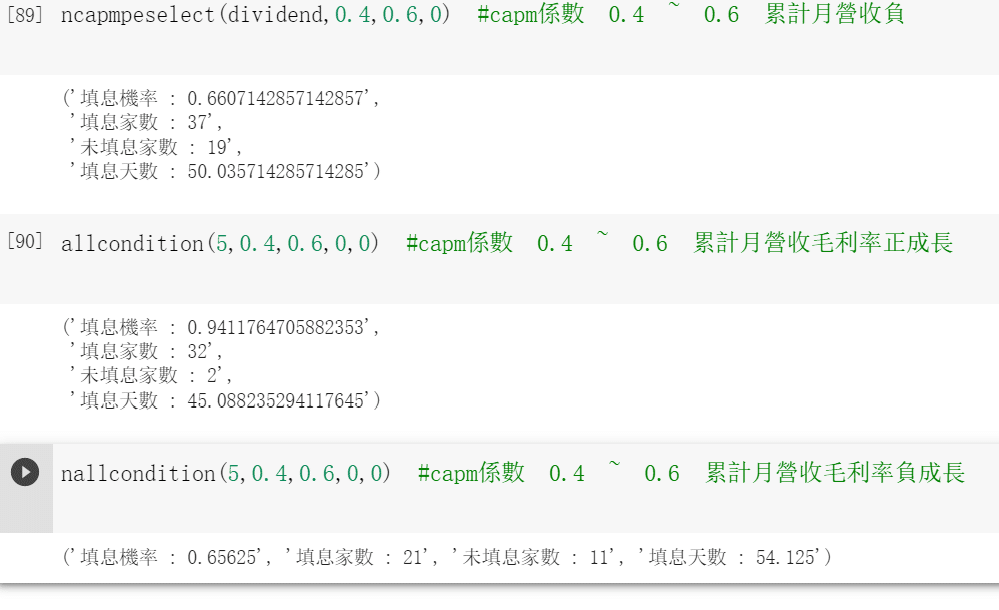
In this group we saw that Stocks with sustained revenue growth and gross profit margins have better perfromance , negative have the worst perfromance.
Below this are the recent 5 years
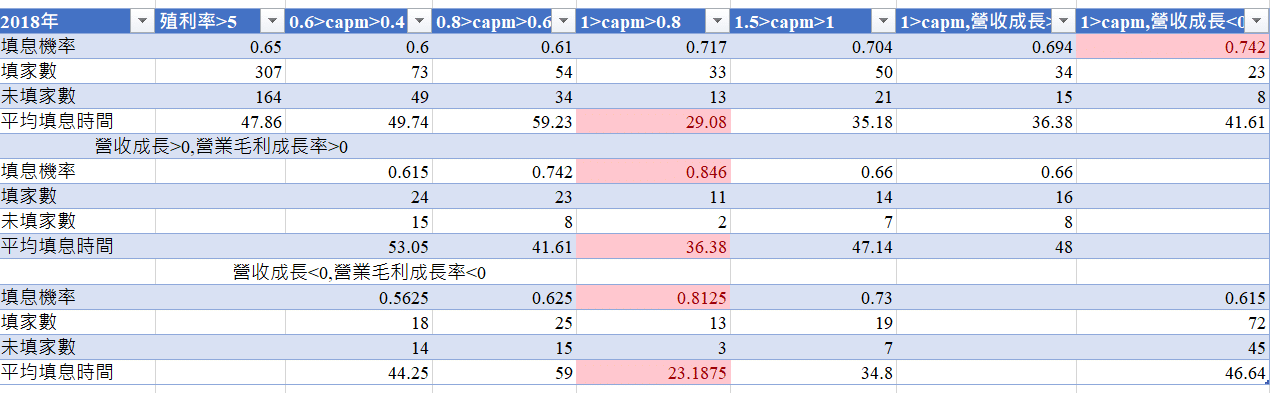
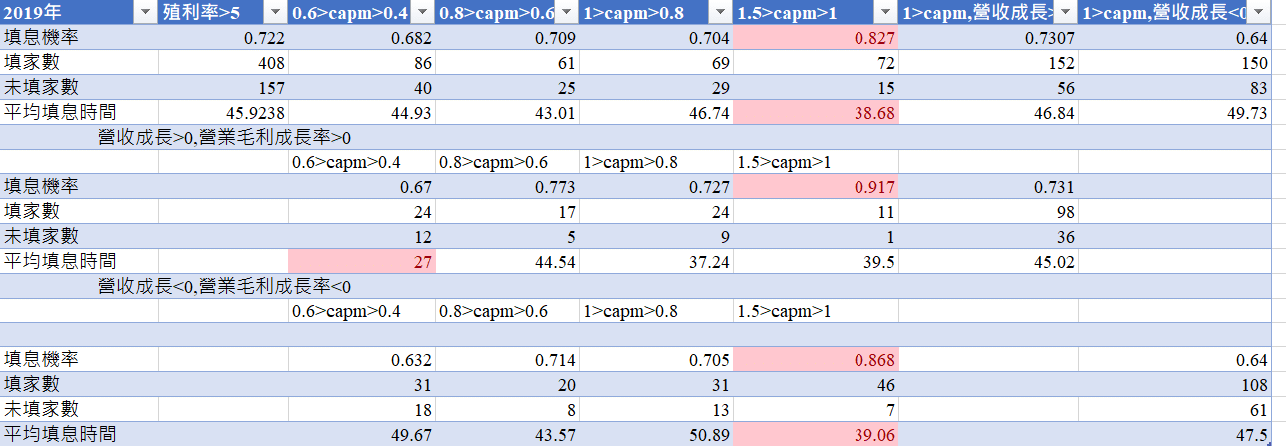
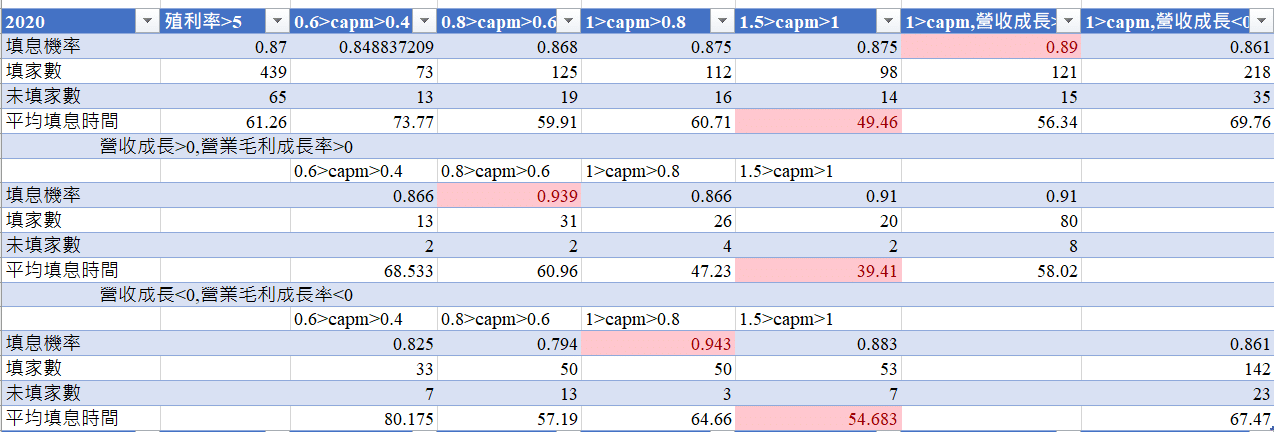
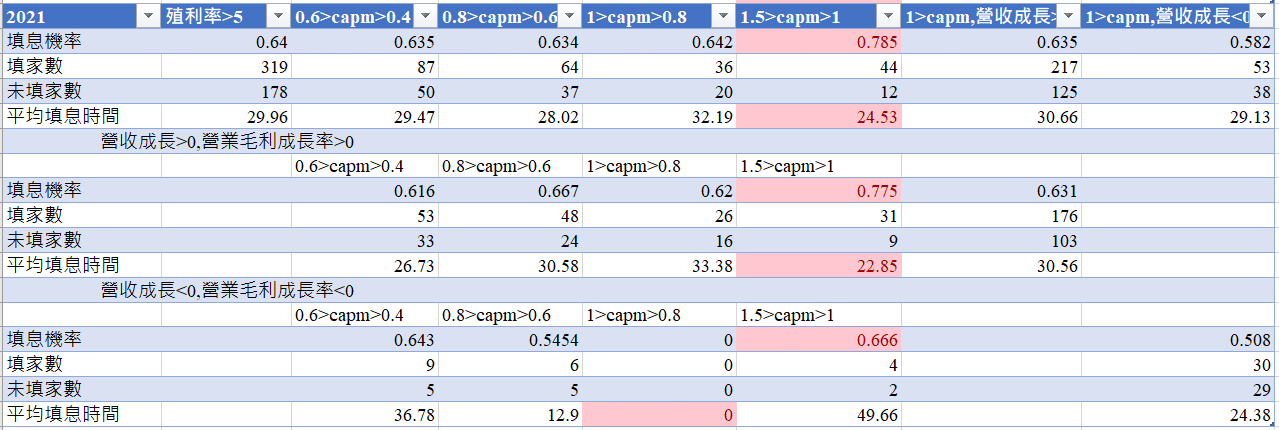
Through observations over the past few years, we have discovered the following:
So we suggest that select growing company is the better way! the stocks which had only one year good performance but decline next year is not the good selection to chose !
The defensive stocks can avoid declines but may not be as active as stocks in terms of recovery ratio! we can not only use the artificial way to judge but also use the machine learning way to judge !
