
Table of Contents
In quantitative investment research, one of the core challenges has always been how to construct factors grounded in transparent and theoretically consistent financial information. Unlike stock price or technical indicators, financial statements provide a direct reflection of a company’s profitability, growth, capital structure, and operating efficiency. However, relying solely on a single financial metric often fails to capture the full picture of corporate value. Moreover, much of the financial data found online has been revised or restated, making it impossible to reproduce the actual information available at the time.
This is precisely where TEJ’s Point-in-Time Audited Financial Database offers a unique advantage. By reconstructing financial data exactly as it was available at each historical moment, it ensures the avoidance of look-ahead bias and provides investors and researchers with a reliable foundation for empirical testing. Building on this Point-in-Time approach, this study attempts to design a comprehensive multi-dimensional factor based on integrated financial statement information, followed by ex-post validation to evaluate its predictive power and stability.
➡️ Get Detail about PIT Audited Financial Database
The study focuses on common stocks listed on the Taiwan Stock Exchange (TWSE) and Taipei Exchange (TPEx) , covering the sample period 2020Q1–2025Q2. The financial data is sourced from TEJ’s Point-in-Time Audited Financial Database
The overall research workflow is structured as follows.
Outlier Treatment:
To mitigate the impact of extreme values on statistical analysis, Winsorization is applied to the following variables:
Each of the above factors was first standardized using the z-score method. We then applied the following weights to combine them into a composite score:
Finally, the composite score was standardized again with z-scores to produce the comprehensive factor score that serves as the output of this study.
📌 You may intetesting: TEJ Factor Library-100+ factors built for Taiwan market
Based on the composite factor scores, we ranked all sample stocks from highest to lowest and divided them into 5 quintile groups. The following section presents the descriptive statistics and performance outcomes derived from these factor-based groupings.
Table 1. Descriptive Statistics of Portfolio Returns by Quintile
| Quintile | Min | Max | Average | Std. Dev. | Count | Proportion % |
|---|---|---|---|---|---|---|
| 1 | -3.155575 | -0.626267 | -1.291114 | 0.383108 | 69,444 | 20.09 |
| 2 | -0.987734 | -0.132098 | -0.534822 | 0.150743 | 68,992 | 19.95 |
| 3 | -0.403942 | 0.549351 | -0.061369 | 0.144642 | 69,008 | 19.96 |
| 4 | 0.053214 | 0.912159 | 0.463535 | 0.173874 | 68,992 | 19.95 |
| 5 | 0.601423 | 9.998278 | 1.425836 | 0.749960 | 69,302 | 20.04 |
As shown in Table 1, the mean returns exhibit a monotonic upward trend from Quintile 1 through Quintile 5, shifting from negative to positive values, which is consistent with the intended design of the factor groupings. The standard deviation is relatively small for the lower quintiles but increases significantly for the higher quintiles,suggesting that stocks in the top group are more prone to extreme values. The maximum value in Quintile 5 is substantially higher than in other groups, reflecting greater heterogeneity and the presence of a few extremely high-scoring stocks.
Table 2. Factor Performance Test Across Holding Periods
| Holding Period | 1D | 5D | 10D | 22D |
|---|---|---|---|---|
| Ann. Alpha | 0.076 | 0.053 | 0.035 | -0.002 |
| Beta | 0.080 | 0.068 | 0.068 | 0.089 |
| Mean Period Wise Return Top Quantile (bps) | 3.470 | 2.775 | 1.999 | -0.181 |
| Mean Period Wise Return Bottom Quantile (bps) | -6.707 | -4.447 | -3.393 | -2.012 |
| Mean Period Wise Spread (bps) | 10.177 | 7.193 | 5.356 | 1.766 |
Table 2 presents the excess returns (alpha), market sensitivity (beta), and the demeaned average returns of the top and bottom quantile portfolios across different holding periods.
These results confirm that the factor exhibits strong short-term effectiveness in distinguishing stock performance, but its predictive power diminishes quickly with longer holding periods.
Figure 1. Average Forward Returns by Quintile
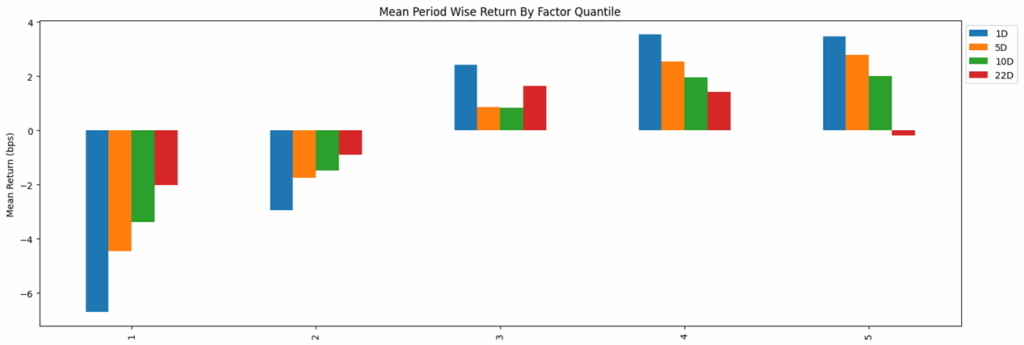
As shown in Figure 1, the factor demonstrates clear differentiation across quintiles. Lower-ranked groups (Q1 and Q2) exhibit negative average returns, while higher-ranked groups (Q3–Q5) generally show positive averages, indicating the factor’s effectiveness. The performance gap between top and bottom quintiles is particularly pronounced in the short term (1D–5D), confirming the factor’s explanatory power for short-term investment strategies. However, as the holding period extends to 22 days, the gap narrows significantly, and in some cases, higher quintiles even exhibit return reversals, suggesting that the factor’s effect weakens over time.
This study leverages TEJ’s Point-in-Time financial statements as the core data source. By designing and integrating multiple factors under a framework free from look-ahead bias, we establish a quantifiable and replicable stock selection mechanism.
Empirical evidence shows that factor scores yield meaningful differentiation in portfolio returns, particularly between the lowest and highest quintiles, validating the factor’s effectiveness and practical value. The results reinforce the feasibility of using financial statement-based factors in investment decision-making and demonstrate the added value of multi-dimensional integration compared to single-indicator approaches.
Nonetheless, several limitations remain:
In sum, this study provides a factor construction and validation framework grounded in financial statement information, highlighting the application potential of financial data in quantitative stock selection. Incorporating broader data sources and dynamic adjustments in the future will further enhance the explanatory power and predictive accuracy of factor models.
TEJ’s Financial Datasets provide comprehensive resources—including PIT audited financial data , preliminary financials, and monthly sales—empowering investors and researchers to enhance the robustness and precision of their quantitative investment strategies.
💡Learn more about TEJ Fiancial Datasets