
Table of Contents
A stock is said to “rebound after dividends” when its price climbs back to or above the closing price before the ex-dividend date, meaning that investors not only receive cash dividends but also avoid a capital loss from the price adjustment. This makes dividend-paying stocks with high rebound potential attractive to investors seeking both income and capital preservation.
This study applies the event study methodology to test whether a company’s historical ex-dividend rebound probability can signal future rebound potential, and whether this probability can serve as a basis for selecting high-yield stocks.
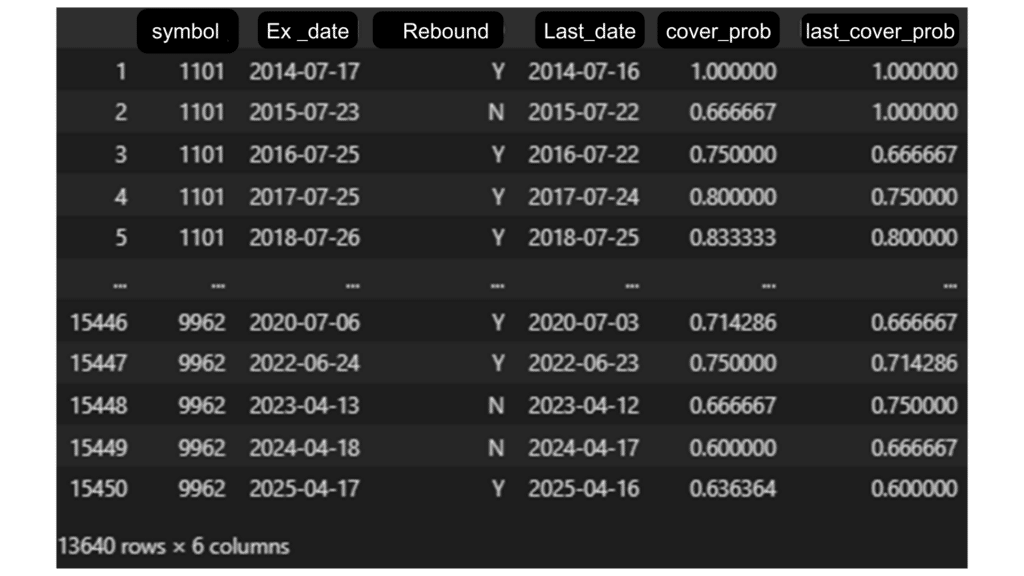
The data used in this research is sourced from the TEJ Financial Database, which offers complete and structured data on listed companies’ dividend policies and ex-dividend events. Key datasets include:
To evaluate whether past rebound success predicts future performance:
After excluding stocks lacking recent rebound records, 13,640 valid entries remained.
The event study framework is a standard approach for analyzing how stock prices react to specific corporate events. It does so by calculating abnormal returns(AR), defined as the difference between a stock’s return and that of a market index. When these differences are aggregated over a period, they form the cumulative abnormal return (CAR), which captures the market’s overall reaction.
This study uses the Market Index Adjustment Model to assess whether stocks outperform the market around the final purchase date (Day T)—the last day investors can buy shares and still receive dividends. By comparing returns before and after this date, we evaluate whether historical rebound probabilities are linked to abnormal price movements.
This study examines whether historical dividend rebound probability can guide stock selection—helping investors capture dividends while avoiding post-dividend capital losses. We define the event day (T) as the last day to purchase shares and still receive dividends.
To measure market reaction, we use a 21-day event window before and after T (T–21 to T+21). For each stock, we calculate:
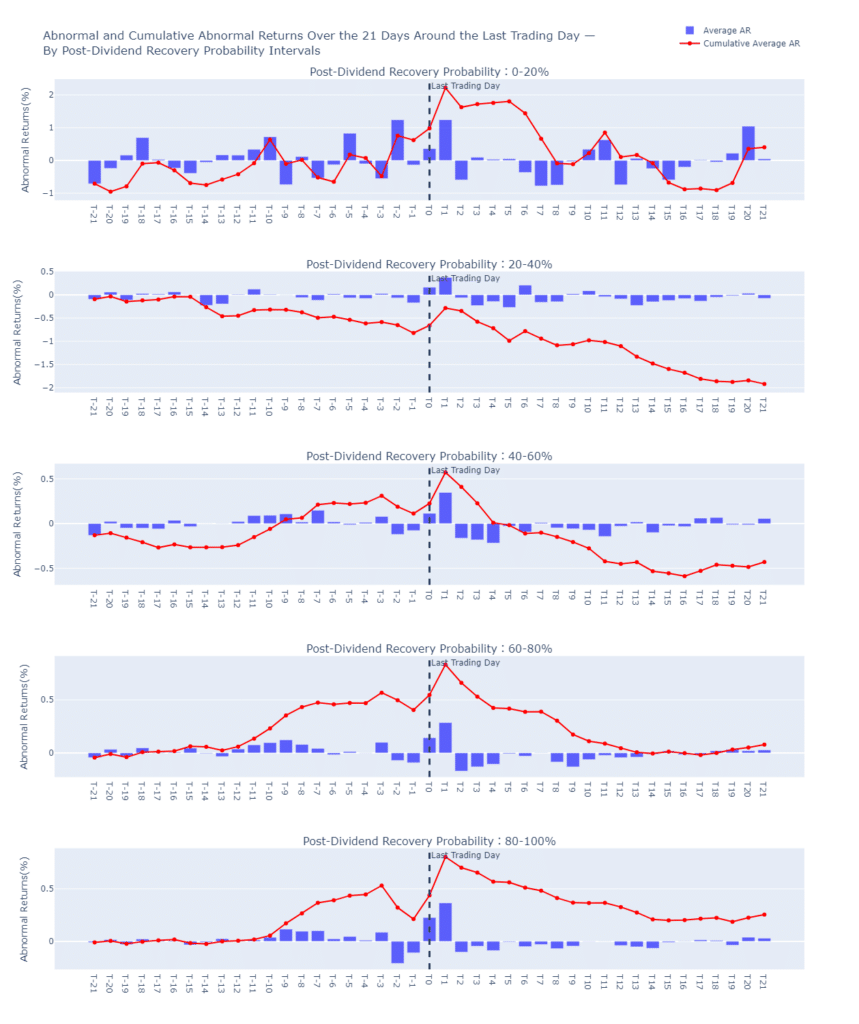
To analyze performance differences, stocks are grouped into five brackets based on their most recent rebound probability: 0–20%, 20–40%, 40–60%, 60–80%, and 80–100%. This allows us to compare how stocks with varying rebound histories behave around the ex-dividend period.
The chat shows stocks with 40–100% rebound probability exhibited significant abnormal returns between T–10 and T–3, with CARs between 0.433% and 0.513%, all statistically significant at the 1% level. This suggests that investors start positioning up to two weeks before T.
Some of this effect may be driven by dividend announcement dates, which often fall two weeks before ex-dividend day.During T–2 to T+2, CARs flattened or declined, indicating that early investors may have exited ahead of retail investors chasing dividends.
After T+3, all high-rebound groups experienced steady selling pressure. CARs turned significantly negative, indicating profit-taking behavior after collecting dividends.
Chart 1, AAR and CAAR around the dividend announcement date ±21 days
Summary Table: CAR (%) Across Time Windows
| Rebound Probability (%) | CAAR(%) at T-21~T-11 | CAAR(%) at T-10~T-3 | CAAR(%) at T-2~T2 | CAAR(%) at T3~T21 | CAAR(%) at T-21~T21 |
|---|---|---|---|---|---|
| 0–20 | -0.085 | -0.396 | 2.106*** | -1.224 | 0.401 |
| 20–40 | -0.327 | -0.259 | 0.239 | -1.570*** | -1.918** |
| 40–60 | -0.152 | 0.462*** | 0.100 | -0.840*** | -0.430 |
| 60–80 | 0.135 | 0.433*** | 0.093 | -0.583*** | 0.078 |
| 80–100 | 0.018 | 0.513*** | 0.170*** | -0.446*** | 0.254* |
To uncover more precise market signals, this study cross-references dividend rebound probability with operating income growth, a fundamental indicator of a company’s core business strength.
Results show that among stocks with a rebound probability above 40%, those with positive operating income growth attract earlier and more persistent buying behavior. Their cumulative abnormal returns (CARs) are significantly stronger in the T–10 to T–3 period and show less downside in the post-dividend T+3 to T+21 period. In contrast, stocks with negative growth, even if historically strong at rebounding, experience a steeper selloff after T+3—suggesting that fundamental weakness undermines investor confidence.
Moreover, the T+3 to T+21 CARs for negative-growth stocks are all significantly negative (ranging from -0.79% to -1.19%), highlighting the market’s skepticism about their ability to sustain performance post-dividend. The data also shows that price differentiation between positive and negative growth stocks becomes more pronounced in the pre-dividend period, especially for those with higher rebound probabilities.

(Only selected groups shown for clarity)
Rebound Probability (%) Operating Income Growth T-21~T-11 T-10~T-3 T-2~T+2 T+3~T+21 T-21~T+21 0-20 % Negative 0.798 1.824 2.144* -5.268* -0.501 Positive -0.615 -1.728 2.084* 1.202 0.942 20-40 % Negative -1.095*** -0.562 -0.020 -2.380** -4.058*** Positive 0.539 0.084 0.531* -0.654 0.500 40-60 % Negative -0.399* 0.235 0.171 -1.194*** -1.187*** Positive 0.137 0.730*** 0.016 -0.424 0.459 60-80 % Negative -0.248* 0.053 0.097 -0.907*** -1.004*** Positive 0.522*** 0.816*** 0.090 -0.256 1.172*** 80-100 % Negative -0.407*** 0.167* 0.080 -0.785*** -0.945*** Positive 0.372*** 0.800*** 0.245*** -0.166 1.251*** *** p < 0.01; ** p < 0.05; * p < 0.10
Overall, stocks with a higher historical dividend rebound probability (40% to 100%) tend to experience a significant surge in buying activity in the one to two weeks prior to the final purchase date (T–10 to T–3), driving cumulative abnormal returns above the market average. When these signals are further filtered by operating income growth, the strength of the pre-event performance becomes even more pronounced.
However, in the post-dividend period (T+3 to T+21), even stocks with high rebound probability may underperform the market if the company lacks fundamental improvement. This suggests that dividend strategies relying solely on historical rebound trends may be vulnerable to reversal if not supported by strong core operations.
Therefore, historical rebound probability serves as a valuable screening tool, but it is the combination of past market behavior and current financial strength that offers the most reliable foundation for identifying dividend stocks with lasting return potential.
This study highlights how combining historical rebound probability with event study techniques and fundamental filters can enhance alpha generation in Taiwan’s equity market. Success in such analysis depends on access to structured, point-in-time, and programmable data.
TEJ’s Quantitative Solutions offer:
Whether you’re building dividend-based alpha models or event-driven trading systems, TEJ’s rich and reliable datasets provide the foundation to move from insight to execution.
“Taiwan stock market data, TEJ collect it all.”
Taiwan Economical Journal (TEJ), a financial database established in Taiwan for over 30 years, serves local financial institutions and academic institutions, and has long-term cooperation with internationally renowned data providers, providing high-quality financial data for five financial markets in Asia.
With TEJ’s assistance, you can access relevant information about major stock markets in Asia, such as securities market, financials data, enterprise operations, board of directors, sustainability data, etc., providing investors with timely and high-quality content. Additionally, TEJ offers advisory services to help solve problems in theoretical practice and financial management!