Table of Contents
Building on the statistical foundation presented in Part 1, this article explores how Idiosyncratic Volatility (IVOL) can be effectively applied in investment strategy design. We present two categories of approaches: a single-factor sorting model and a set of filter-enhanced momentum strategies. Through robust backtesting across two decades of Taiwan stock market data, we demonstrate how IVOL can improve risk-adjusted performance when used as a portfolio filter—especially when combined with momentum or dividend-based signals.
👉 Part 1:Factor Research-Idiosyncratic Volatility
Building on the earlier analysis, we now evaluate IVOL’s practical investment applications. Two categories of strategies are tested:
Backtests are conducted over Jan 2005 – Mar 2025, rebalanced monthly, with an initial capital of NT$10 million allocated equally across 50 selected stocks.

Each month, stocks are ranked by one of the following factors, and the top 50 are selected:
📌 All data and factors are sourced from the TEJ Factor Library, which enables clean monthly signal construction and portfolio simulation.
Table 1: Performance of Single-Factor Strategies
Benchmark: TAIEX Total Return Index, Jan 2005 – Mar 2025)
| Metric | IVOL | MOM52WH | DP | Benchmark |
|---|---|---|---|---|
| Annual Return | 3.57% | 13.40% | 5.93% | 10.41% |
| Cumulative Return | 99.93% | 1099.27% | 211.92% | 607.56% |
| Annual Volatility | 7.94% | 12.27% | 12.96% | 18.02% |
| Sharpe Ratio | 0.482 | 1.087 | 0.510 | 0.640 |
| Sortino Ratio | 0.635 | 1.490 | 0.670 | 0.887 |
| Max Drawdown | -38.72% | -37.70% | -50.49% | -56.02% |
| Alpha | -0.001 | 0.082 | 0.002 | – |
| Beta | 0.343 | 0.470 | 0.559 | – |
Figure 2: Cumulative Returns of Single-Factor Strategies
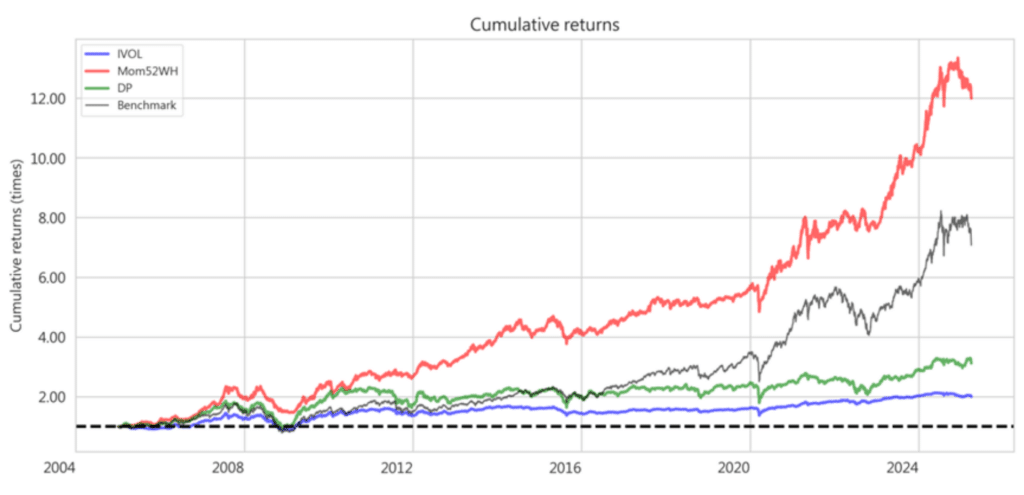
💡 Conclusion: IVOL is not ideal as a standalone alpha factor, but it has potential when used in combination with other signals for risk control.
To improve momentum strategies, we apply IVOL and/or DP as filters before ranking by MOM52WH:
This approach reflects prior findings—high-IVOL stocks often have low dividend yield and poor return quality.
Table 3: Performance of Filter-Enhanced Momentum Strategies (Jan 2005 – Mar 2025)
| Metric | MOM52WH | + IVOL Filter | + DP Filter | + IVOL & DP Filters | Benchmark |
| Annual Return | 13.40% | 12.93% | 15.23% | 15.44% | 10.41% |
| Cumulative Return | 1099.27% | 1004.23% | 1542.76% | 1603.16% | 607.56% |
| Annual Volatility | 12.27% | 8.79% | 9.50% | 8.68% | 18.02% |
| Sharpe Ratio | 1.087 | 1.428 | 1.540 | 1.697 | 0.640 |
| Sortino Ratio | 1.490 | 1.964 | 2.123 | 2.346 | 0.887 |
| Max Drawdown | -37.70% | -37.81% | -36.75% | -36.72% | -56.02% |
| Alpha | 0.082 | 0.084 | 0.103 | 0.108 | – |
| Beta | 0.470 | 0.390 | 0.418 | 0.389 | – |
Figure 4: Cumulative Returns of Filtered Strategies
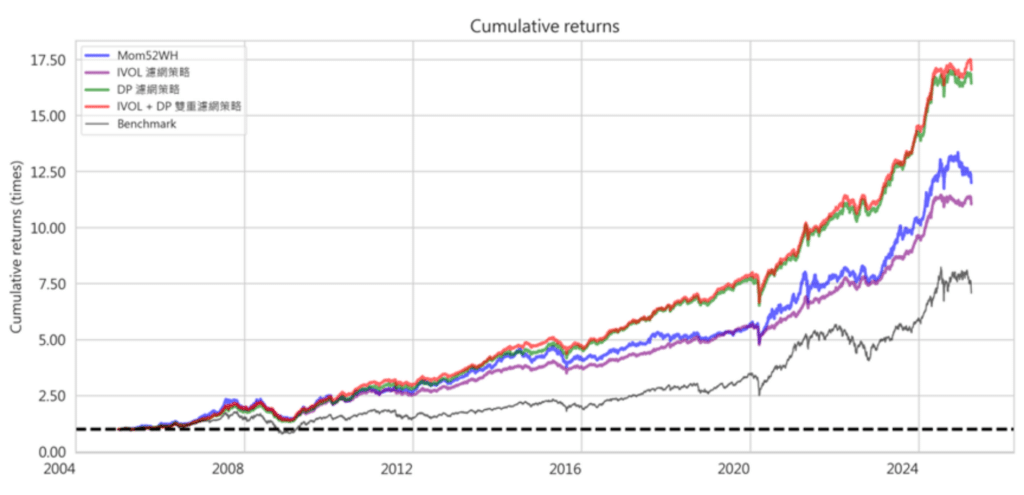
📌 This validates IVOL’s value as a risk management filter, especially when paired with alpha-generating signals like momentum.
This study examines the validity of Idiosyncratic Volatility (IVOL) as an investment factor in Taiwan’s stock market. After reviewing theoretical foundations and prior research, we first confirmed the presence of the low-volatility anomaly in Taiwan. We then analyzed the cross-sectional relationship between IVOL and future returns.
The factor analysis revealed a stable and significant negative relationship between IVOL and subsequent stock performance. However, when IVOL was used alone to construct a single-factor strategy, the resulting returns were relatively weak. In contrast, using IVOL as a risk filter in combination with momentum factors led to substantial improvements in risk-adjusted returns, suggesting that excluding high-IVOL stocks may enhance overall portfolio quality.
Overall, IVOL may not be suitable as a standalone selection factor, but it holds practical value when used as a risk screening condition. This conclusion aligns with the view that low-volatility anomalies are driven by the underperformance of high-risk stocks, rather than the superior returns of low-risk stocks.
In practice, IVOL supports not only return enhancement, but also risk control and portfolio construction in a multi-factor setting.
The TEJ Factor Library provides over 100 standardized alpha factors—including IVOL, momentum, valuation, and quality—built with point-in-time methodology for clean backtests. Combined with TEJ Market & Financial Data, it enables seamless:
📩Explore how IVOL and other factors perform in your portfolio universe?
Visit TEJ Factor Library or contact us to request a custom factor analysis demo.