
Table of Contents
Article Difficulty: ★★☆☆☆
A stock selection strategy for high-tech companies.
The Michael Murphy strategy is backtested using TQuant Lab to evaluate the performance of its investment factors.
With the rapid development of the high-tech industry, technology stocks have increasingly become the focus of the market. While these stocks offer significant growth potential, they also come with high volatility and substantial investment risk. Investors seeking high returns may face major losses if they fail to properly assess the associated risks. Therefore, effectively measuring and managing the downside risk of high-tech stocks has become a crucial component of sound investment decision-making.
In TQuant Lab, we begin by selecting stocks from the electronics industry as our stock universe. Users can customize the specific technology sectors based on their individual needs.
All the following data fields are derived from the TQuant Lab dataset.
rolling(12).mean.If C or D is negative, replace the value with 0.
Deviation Value
= ( Current Price – Downside Risk Value ) / Current Price
Relationship Between Deviation Value and Risk
A positive deviation value indicates a higher risk of sharp decline. The larger the positive value, the higher the risk.
A negative deviation value suggests the stock is suitable for investment, and the more negative it is, the safer the investment.
| Performance Metric / Strategy | Market Benchmark | Michael Murphy Investment Strategy |
|---|---|---|
| Annualized Return | 16.275% | 15.767% |
| Cumulative Return | 177.386% | 169.287% |
| Annualized Volatility | 17.279% | 19.856% |
| Sharpe Ratio | 0.96 | 0.84 |
| Calmar Ratio | 0.57 | 0.45 |
| Maximum Drawdown (During Period) | -28.553% | -35.045% |
From the overall performance indicators, although the Michael Murphy Investment Strategy achieves an annualized return of 15.767% and a cumulative return of 169.287%, which are only slightly below the benchmark (16.275% and 177.386%, respectively), its performance in risk control is relatively weaker.
The strategy exhibits a higher annualized volatility of 19.856% compared to the market’s 17.279%, and a lower Sharpe ratio of 0.84 versus the benchmark’s 0.96, indicating that its risk-adjusted return is inferior to the market despite taking on greater risk. In addition, the maximum drawdown during the period reaches -35.045%, which is larger than the benchmark’s -28.553%, suggesting the strategy is more vulnerable to capital loss during market downturns.Overall, while the Michael Murphy strategy demonstrates a reasonable return potential, it still underperforms the benchmark in terms of risk-adjusted performance and capital preservation.
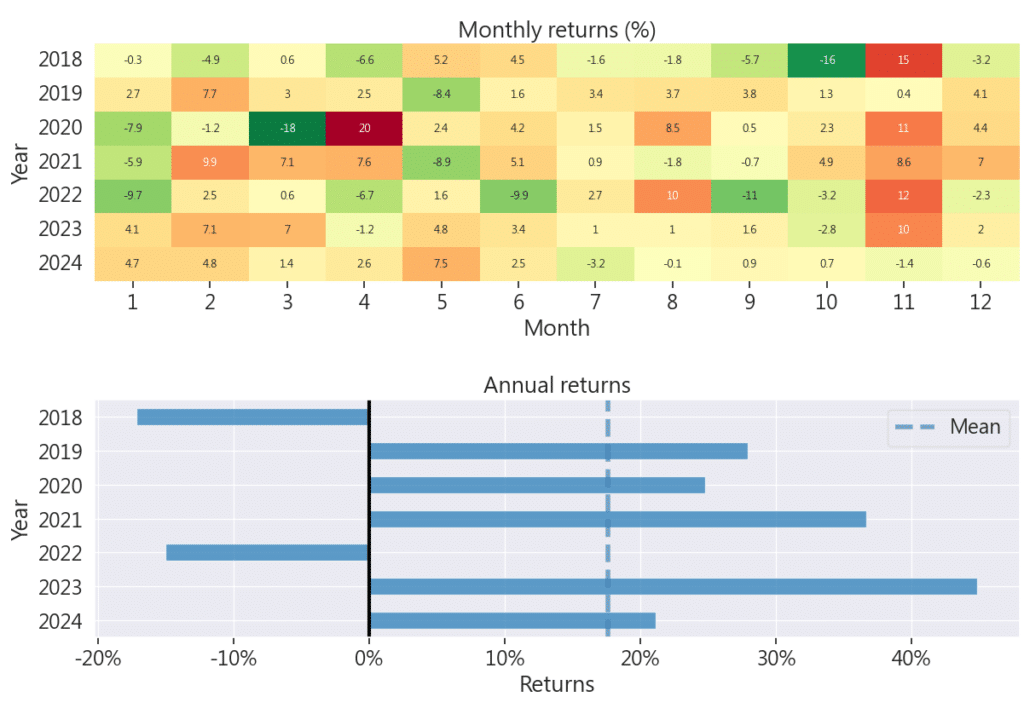
The annualized return chart shows that the strategy performs well in most years, with particularly impressive performance in 2023, where the annual return exceeded 40%. This highlights the strategy’s strong profit potential under favorable market conditions. Although the strategy experienced negative returns in 2018 and 2022, such losses can be managed through appropriate take-profit and stop-loss settings.
This strategy focuses on the high-tech industry, selecting the top 40 stocks with the smallest deviation values. A lower deviation value indicates that a stock’s price deviates less from its downside risk benchmark, reflecting more stable pricing and lower downside risk.
While the tech sector offers high growth potential, it also comes with high volatility and risk. This strategy effectively identifies relatively stable investment targets in such a high-risk environment.
Backtesting results show that the strategy delivers returns comparable to the overall market while also demonstrating solid risk control. However, by prioritizing stability and downside protection, the strategy may filter out high-growth “rocket stocks”, leading to underperformance in strong bull markets where broader indices trend upward more sharply.
Important Reminder: This analysis is for reference only and does not constitute any product or investment advice.
We welcome readers interested in various trading strategies to consider purchasing relevant solutions from Quantitative Finance Solution. With our high-quality databases, you can construct a trading strategy that suits your needs.
“Taiwan stock market data, TEJ collect it all.”
The characteristics of the Taiwan stock market differ from those of other European and American markets. Especially in the first quarter of 2024, with the Taiwan Stock Exchange reaching a new high of 20,000 points due to the rise in TSMC’s stock price, global institutional investors are paying more attention to the performance of the Taiwan stock market.
Taiwan Economical Journal (TEJ), a financial database established in Taiwan for over 30 years, serves local financial institutions and academic institutions, and has long-term cooperation with internationally renowned data providers, providing high-quality financial data for five financial markets in Asia.
With TEJ’s assistance, you can access relevant information about major stock markets in Asia, such as securities market, financials data, enterprise operations, board of directors, sustainability data, etc., providing investors with timely and high-quality content. Additionally, TEJ offers advisory services to help solve problems in theoretical practice and financial management!
