
Table of Contents
The SuperTrend Indicator is a technical analysis tool for identifying trends in stock markets, aiding investors in determining market swings, and enhancing buy-sell timing. The SuperTrend Indicator is especially suitable for investors who need help discerning market directions or frequently exit trades too early, missing out on potential gains. However, one drawback of the SuperTrend Indicator is its tendency to be less effective during consolidation phases. Hence, by combining it with the Average Directional Index (ADX), which measures trend strength, we can refine this strategy to filter out noisy signals better and improve entry and exit decisions.
This indicator tracks trends by plotting upper and lower bands around price movements. When the price crosses above the upper band, it signals a potential upward trend; crossing below signals a downward trend.
To calculate the upper and lower bands of the SuperTrend Indicator, we need to follow three steps:
Step1: Calculate ATR
The ATR ( Average True Range ) is based on the TR ( True Range ), representing the maximum price movement within a specific period. The TR is usually determined by the greatest absolute value among the following three differences:
The ATR is obtained by applying a moving average to the TR over a specified period, typically 14 days.
p.s. For more applications of ATR, you can refer to: TQuant Lab Loss Aversion Strategy — Average True Range.
Step2: Calculate Basic Upper and Lower Bands
The formulas for the basic upper and lower bands are as follows:
The Multiplier is a factor used to adjust the distance of the bands.
Step3: Calculate Final Upper and Lower Bands
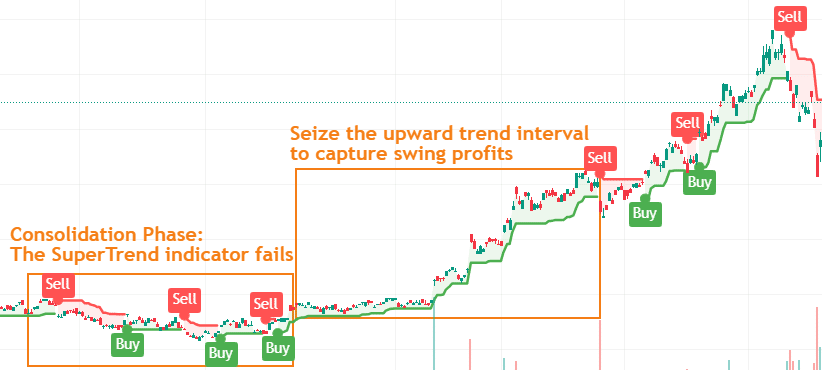
The diagram above illustrates the SuperTrend Indicator applied to a price chart. We can observe that the SuperTrend Indicator effectively identifies upward trending phases; however, it produces noise during consolidation phases, leading to less reliable signals. To mitigate this, we pair the SuperTrend Indicator with the ADX, which helps us determine the trend’s strength. This combination allows us to construct a more robust SuperTrend strategy. Below, we will explain the formulas behind the SuperTrend and ADX indicators to provide insight into their inner workings.
The ADX indicator, developed by J. Welles Wilder in 1978, measures the strength of a trend and ranges from 0 to 100, with higher values indicating more robust trends. By combining the SuperTrend Indicator with the ADX, we can more effectively differentiate between trending and consolidating phases.
The ADX indicator ranges from 0 to 100, with the following interpretations:
The ADX calculation involves four steps:
Step1: Calculate ATR
The ATR is calculated in the same manner as in the SuperTrend Indicator.
Step2: Calculate +DM, -DM ( Directional Movement )
Step3: Calculate +DI, -DI ( Directional Indicator )
Step4: Calculate ADX
DX = 100 × ( |+DI – (-DI)| / |+DI + (-DI)| )
The ADX is obtained by applying a moving average to the DX over a specified period.
The following demonstrates how we will generate the trading signals required for the SuperTrend strategy using TQuant Lab.
The following demonstrates how we will generate the trading signals required for the SuperTrend strategy.
We set the followin data and rule to backtest.
Start Building Portfolios That Outperform the Market!
To create a balanced SuperTrend strategy, we use the ADX to confirm trend strength and adjust the entry/exit rules :
This combined approach mitigates SuperTrend’s sensitivity in flat markets, improving profitability in trend-driven segments.
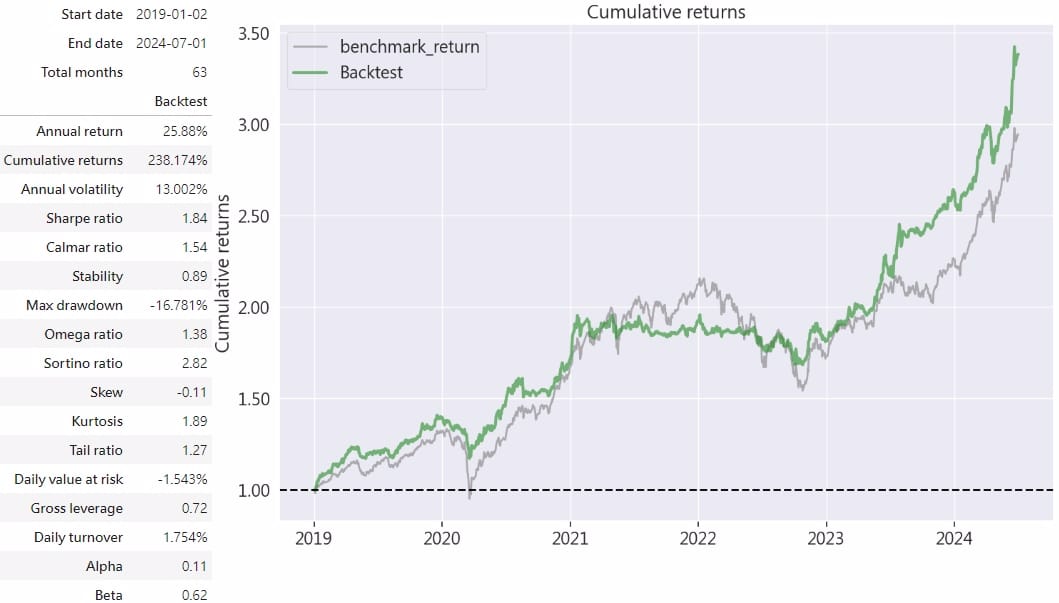
As shown in the table above, the SuperTrend strategy achieved an annualized return of 25.88%, with a relatively low annualized volatility of around 13%. When further examining the performance metrics, the Sharpe ratio is 1.84, and the Sortino ratio is 2.82, indicating that the SuperTrend strategy effectively avoids downside risks while earning excess returns with relatively lower risk.
Observing the performance curve, although the SuperTrend strategy did not significantly outperform the market, we can see that after reaching a peak at the beginning of 2021, the returns leveled off until mid-2022, successfully avoiding the significant downturn of the 2022 bear market. Moreover, there was a good recovery trend after 2023, demonstrating the SuperTrend strategy’s ability to lock in profits during uptrends and preemptively avoid downside risks.
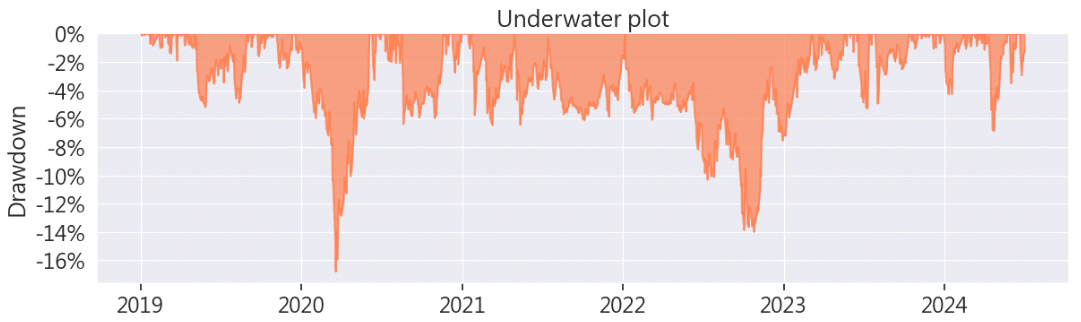
The underwater plot chart shows that the two most significant drawdowns occurred during the pandemic in early 2020 and the bear market in 2022. However, compared to the 30% drawdown experienced by the broader market during these periods, the SuperTrend strategy’s 16% and 14% drawdowns were relatively minor.
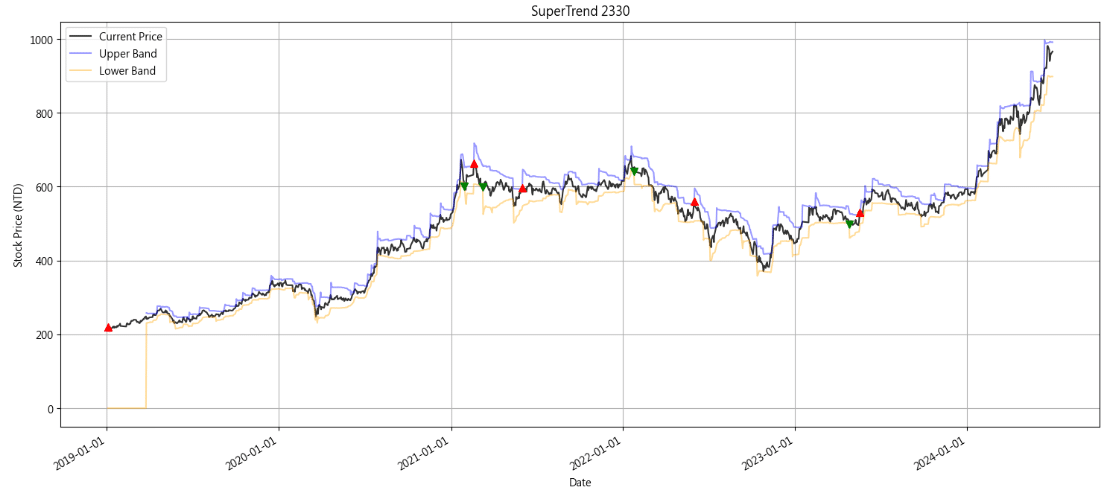
Take the famous company in Taiwan – TSMC as a sample to understand the performance of individual stocks under the Super Trend strategy. In the chart, red dots represent entry points, and green dots represent exit points. We can see that the SuperTrend strategy successfully profited during the uptrend from 2019 to 2020. However, during the consolidation phase in 2021 and the downtrend in 2022, there were some cases where it bought at relatively high points, indicating a failure. Fortunately, the sell points optimized by the ADX indicator limited some of the losses, and the buy point in 2023 successfully captured the profits up to July 2024.
This strategy was inspired by the Super Trend indicator. Given the indicator’s failure during consolidation phases, we used the ADX indicator to optimize the strategy and reduce short-term trading noise. This strategy effectively captured uptrend gains and minimized losses, particularly valuable given the recent bullish trends in Taiwan’s tech-heavy stock index. TEJ’s comprehensive financial data on Taiwanese equities allowed for accurate trend following and risk management.
Please note that the strategy and target discussed in this article are for reference only and do not constitute any recommendation for specific commodities or investments.
TEJ provides extensive, high-quality financial data covering the Taiwan stock market, tailored for market trend analysis. As the Taiwan Stock Exchange recently peaked due to rising semiconductor stocks, TEJ’s data allows investors to monitor trends closely and craft strategies tailored to Taiwan’s unique market dynamics.
Taiwan Economic Journal (TEJ), a financial database established in Taiwan for over 30 years, serves local financial institutions and academic institutions, and has long-term cooperation with internationally renowned data providers, providing high-quality financial data for five financial markets in Asia.
With TEJ’s assistance, you can access relevant information about major stock markets in Asia, such as securities market, financials data, enterprise operations, board of directors, sustainability data, etc., providing investors with timely and high-quality content!
