
Table of Contents
In the investment world, small-cap growth stocks have long attracted the attention of professional investors and fund managers due to their high growth potential and price flexibility. Robert Gardiner, a renowned U.S. fund manager, is a prominent figure in this field. He is best known for managing the Wasatch Micro Cap Fund, achieving exceptional results even during the turbulent U.S. market conditions in 2000 and 2001, with annual returns exceeding 30% and nearly 50%, respectively—far outperforming the broader market. His stock-picking approach has demonstrated strong resilience and remarkable growth capability.
At the core of Gardiner’s strategy is the identification of companies with relatively small market capitalizations, strong earnings growth, and solid fundamentals. Through his proprietary ABGC framework and the application of the GARP (Growth at a Reasonable Price) philosophy, he focuses on potential stocks with a price-to-earnings growth (PEG) ratio below 1. This forms a systematic yet flexible investment approach. To test the applicability of this strategy in the Taiwanese stock market, this study adopts Gardiner’s screening principles to develop a set of quantifiable selection criteria, conducts backtesting on Taiwan equities, and further explores the empirical performance of small-cap growth investing in the local market.
In replicating Robert Gardiner’s stock-picking strategy, we focus on the core of his investment philosophy: investing in small-cap companies with strong growth potential and purchasing them at reasonable prices. While Gardiner incorporates a degree of subjective judgment in his selection process—such as assessing management quality and competitive advantages—for the sake of quantitative implementation, we translate his principles into the following measurable financial indicators:
To evaluate the applicability of Robert Gardiner’s stock selection logic in the Taiwanese stock market, this study conducts a backtest spanning from January 1, 2015, to May 27, 2025. A concrete strategy execution framework is designed and implemented as follows:
This strategy systematically implements Gardiner’s investment philosophy. By applying a fixed rebalancing schedule and equal-weighted allocation, it avoids excessive concentration in individual holdings and helps mitigate the risk of overtrading.
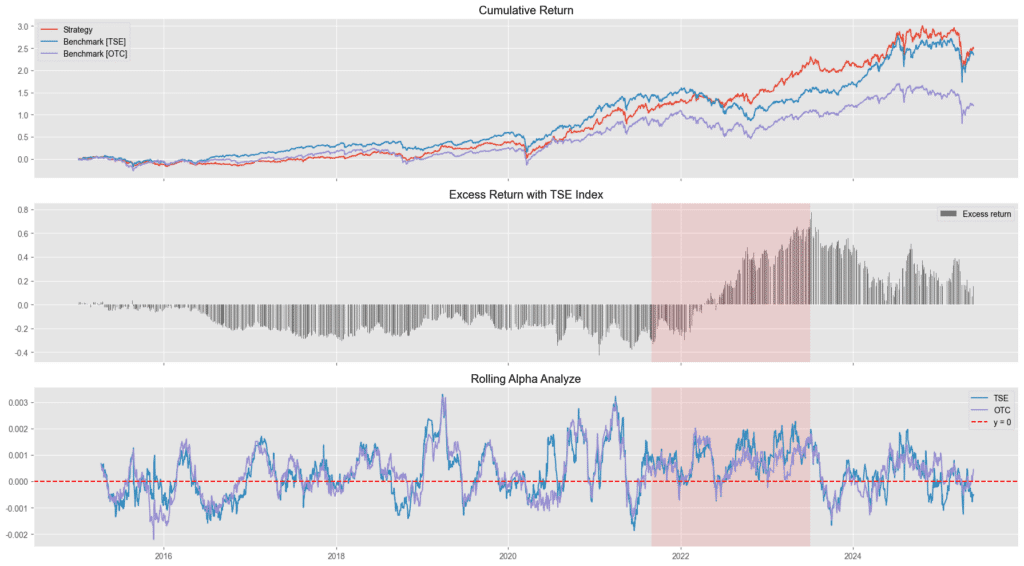
In the red highlighted area of the chart above, we observe that the excess return in the second subplot turns from negative to positive, outperforming the broader market (represented by the TAIEX). At the same time, in the Rolling Alpha subplot, the alpha value also shifts from negative to positive and remains in positive territory for approximately one year. This period coincides with a transitional phase between a bear and bull market, during which the overall market was highly volatile. Despite such conditions, the strategy was able to consistently generate returns, demonstrating strong stock-picking capability and the ability to identify promising stocks regardless of broader market trends. This hypothesis will be further examined in the next chart.
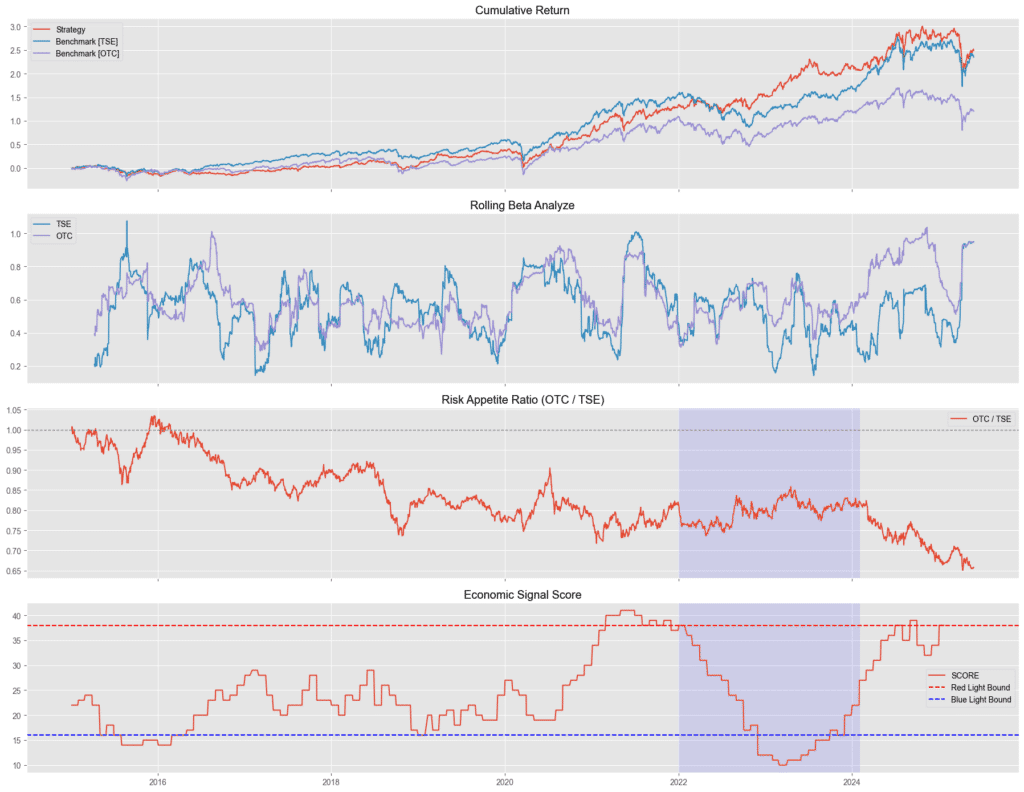
The chart above displays the cumulative return of the strategy compared to the OTC and TSE indices, the rolling BETA, the OTC/TSE ratio (serving as a proxy for market risk appetite), and the economic signal light score, which helps distinguish between bull and bear markets.
In the blue-highlighted area, we can observe a transition period where the market is gradually shifting from a bear market to a bull market. During this time, the broader indices experienced noticeable pullbacks. However, the strategy’s returns began to decouple from the market and continued to rise steadily. In the corresponding second subplot, the BETA values hovered around 0.5 for both OTC and TSE indices, indicating that the strategy’s returns were not heavily dependent on overall market performance. Instead, the excess returns (alpha) stemmed from effective stock selection, reinforcing the conclusions drawn from earlier analysis.
However, in the more recent period post-2025, the OTC/TSE ratio sharply declines, reflecting increased investor preference for large-cap stocks. This could also suggest that rising market uncertainty in 2025 has led to more conservative risk preferences among market participants, making it difficult for small-cap stocks to perform well in the short term. Therefore, I believe that the strategy’s edge will reemerge once market uncertainty subsides, at which point growth-oriented stock selection strategies can once again be effectively deployed.
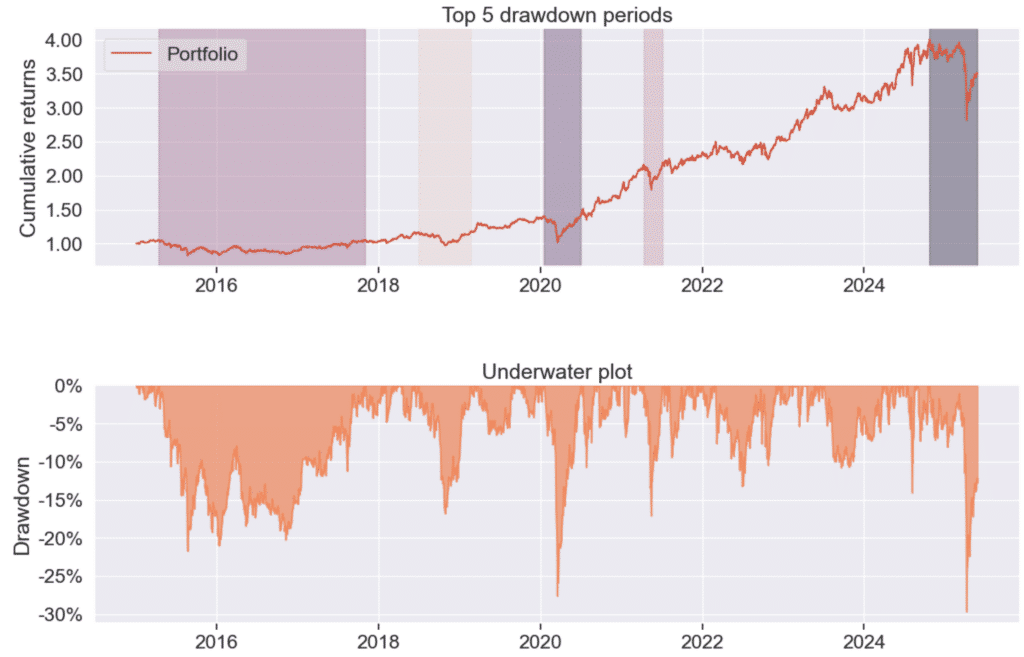
From the drawdown chart, the strategy exhibits a maximum drawdown of approximately -30%, indicating relatively high volatility. This is especially evident in early 2025, when market capital rotated toward large-cap stocks, putting pressure on the strategy’s performance. Since the strategy focuses on small-cap growth stocks, it tends to struggle during periods of declining risk appetite, naturally resulting in wider drawdowns.
Despite these fluctuations, the strategy demonstrated strong excess return potential during phases of rising risk appetite—particularly from 2022 through late 2023—while maintaining relatively limited drawdowns. It is therefore recommended to incorporate a simple market factor, such as the OTC/TSE ratio, as a supplementary signal for adjusting exposure or determining entry and exit points. Doing so may enhance the overall stability and risk management of the strategy.
Here’s the table translated into English:
| Backtest Index | Robocadian Investment Strategy | Weighted Stock Index (Overall Market) | OTC Index (OTC) |
| Cumulative Return | 249.33% | 234.56% | 121.744% |
| Annualized Return | 13.257% | 12.77% | 8.25% |
| Annualized Volatility | 16.61% | 16.67% | 18.70% |
| Sharpe Ratio | 0.83 | 0.81 | 0.52 |
| Calmar Ratio | 0.45 | 0.45 | 0.25 |
| Max Drawdown | -29.67% | -28.97% | -33.137% |
Important Reminder: This analysis is for reference only and does not constitute any product or investment advice.
We welcome readers interested in various trading strategies to consider purchasing relevant solutions from Quantitative Finance Solution. With our high-quality databases, you can construct a trading strategy that suits your needs.
“Taiwan stock market data, TEJ collect it all.”
The characteristics of the Taiwan stock market differ from those of other European and American markets. Especially in the first quarter of 2024, with the Taiwan Stock Exchange reaching a new high of 20,000 points due to the rise in TSMC’s stock price, global institutional investors are paying more attention to the performance of the Taiwan stock market.
Taiwan Economical Journal (TEJ), a financial database established in Taiwan for over 30 years, serves local financial institutions and academic institutions, and has long-term cooperation with internationally renowned data providers, providing high-quality financial data for five financial markets in Asia.
With TEJ’s assistance, you can access relevant information about major stock markets in Asia, such as securities market, financials data, enterprise operations, board of directors, sustainability data, etc., providing investors with timely and high-quality content. Additionally, TEJ offers advisory services to help solve problems in theoretical practice and financial management!
From Business Cycle Indicators to Asset Rotation: A Quantitative Strategy to Avoid Bear Markets
Michael Murphy’s Risk Assessment Rules for Investing in High-Tech Stocks
Charles Brandes’ Value Investing Principles : Building a Portfolio with a Margin of Safety
