Use algorithm to learn the investment factors and predict returns.

Table of Contents
We talked about how to create new enviornment and install XGBoost last time. If you haven’t read it yet, please click this link. In this article we will make some preprocessing on data. Then train the model to predict the stock returns and try to analyze which factor is the most important.
Mac OS and Jupyter Notebook
# basic
import numpy as np
import pandas as pd# graphy
import matplotlib.pyplot as plt
%matplotlib inline# machine learning
from sklearn.metrics import mean_squared_error
from sklearn.model_selection import train_test_split
import xgboost as xgb# TEJ
import tejapi
tejapi.ApiConfig.api_key = "Your Key"
tejapi.ApiConfig.ignoretz = True
TWN/APRCM Which covers the indicators used by scholars to measure factors since 2000, and the data frequency is monthly data.TWN/APRCM Target listed securities and indexes.We use all listed companies of investment factors during 2000~2015 to predict whether the return rate from 2016 to 2017 is positive or negative.
df = tejapi.get('TWN/AFF_RAW',
                mdate={'gte': '2000-01-01', 'lte':'2015-12-31'},
                opts={'columns':['coid','mdate','pbr','per',
                      'div_yid','mom','str','ltr','profit','invest',
                      'dd_merton','dd_kmv','illiq','idiosyncratic',
                      'hhi','skew']},
                chinese_column_name = True,
                paginate = True)
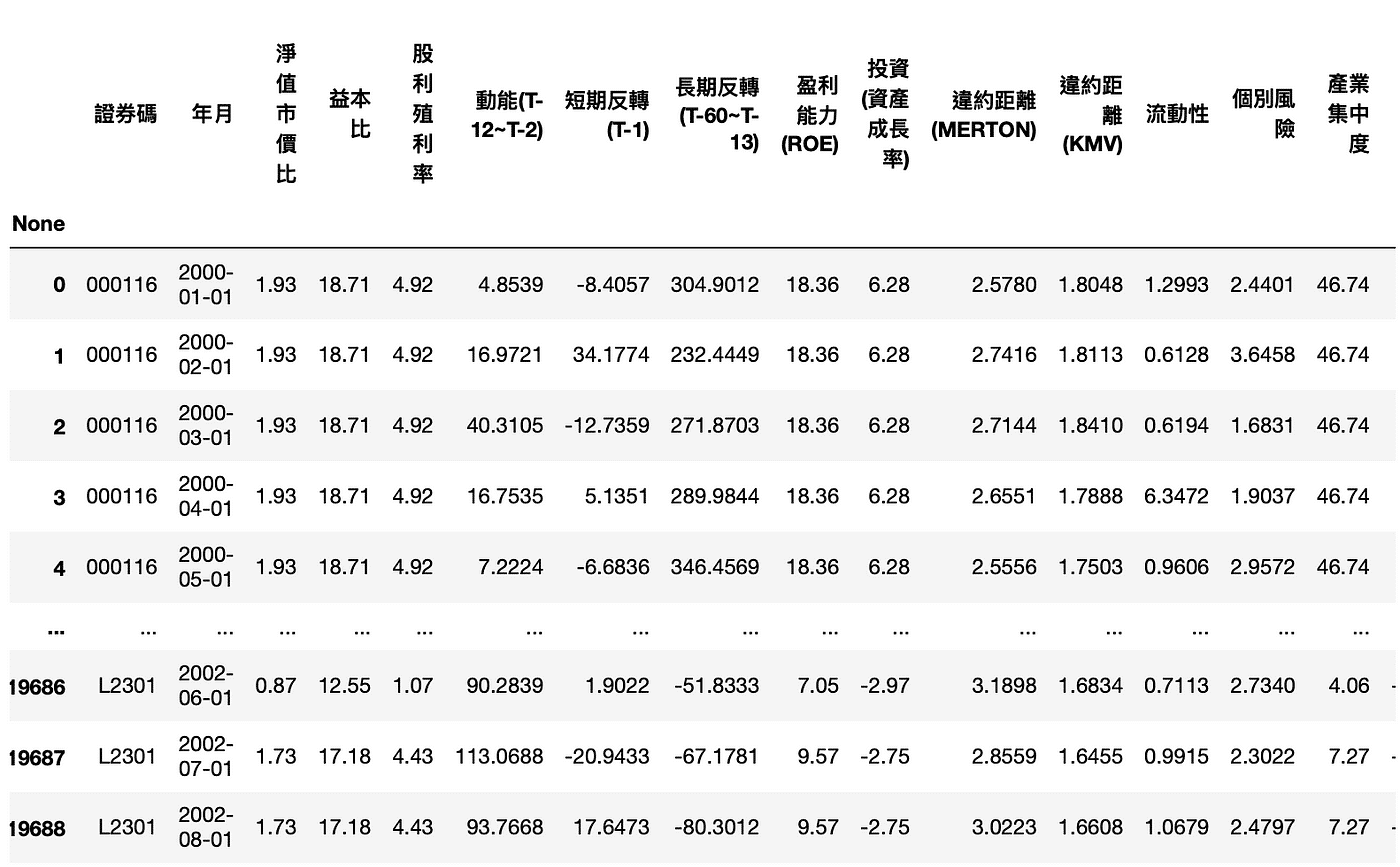
df.isnull().sum(axis=0)
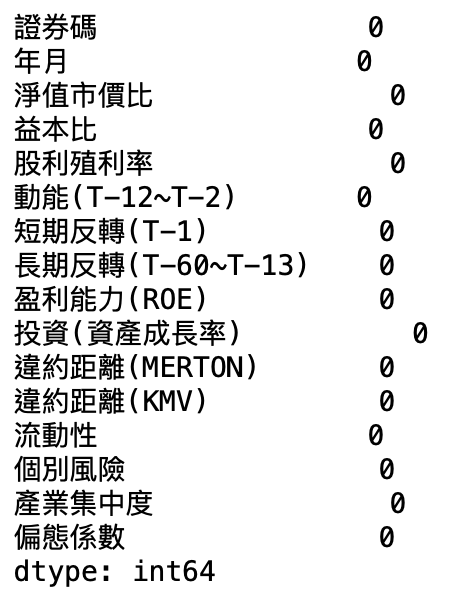
If there are missing values, directly thrown into the model, it will be impossible to calculate. However, the XGBoost model can handle sparse matrices and can tolerate the existence of missing values. However, if we can fill in the missing values reasonably, it will help us to enhance the model. The common method is to fill in the “average”, “median”, or directly fill in 0. The syntax used is fillna. As for what to fill in, you can do some exploratory data analysis on the data first ( Exploratory Data Analysis, EDA), then this will be another important point, and we will spend another time to introduce it in the future!
# 處理時間
from datetime import date, timedelta
import calendar
Switch one month
df['年月'] = df['年月'].apply(lambda x: x + timedelta(days=calendar.monthrange(x.year, x.month)[1]))
Generally speaking, in machine learning, standardizing data will improve the predictive power of the model, but this step is not required in XGBoost. The rough explanation is: standardization is to deal with continuous features, and the main function is to perform numerical scaling (minus the average value). , Divided by the standard deviation). The purpose of numerical scaling is to solve the problem of increasing the number of iterations due to the contour line being an ellipse when the gradient is descent. However, the previous article mentioned that XGBoost is a tree model, and gradient descent cannot be performed, because the tree model is step-by-step and cannot be used as a derivative. Instead, optimization is done by finding the optimal split point of the feature. Since standardization does not change the location of the split point, XGBoost does not need to standardize the data!
df_label = tejapi.get('TWN/APRCM',
                mdate={'gte': '2000-01-01', 'lte':'2015-12-31'},
                opts = {'columns':['coid','mdate','roi']},
                chinese_column_name = True,
                paginate = True)
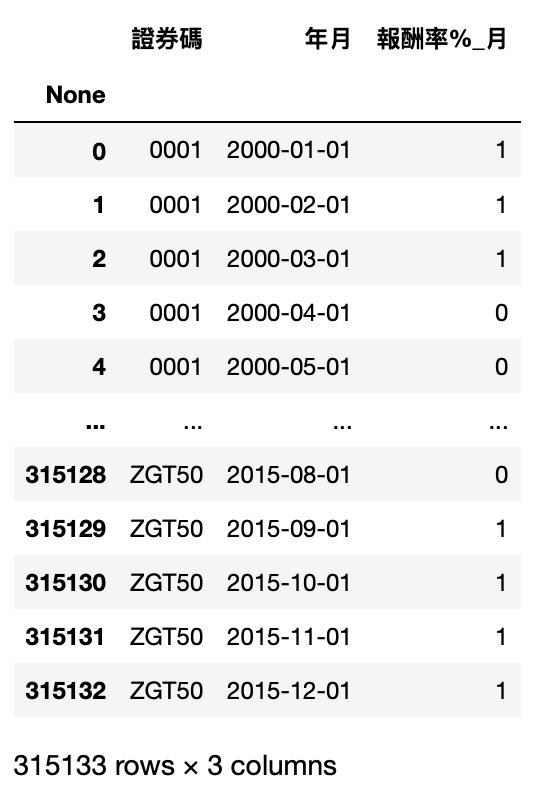
Set to 1 if it is a positive reward, and 0 if it is a negative reward.
df_label['報酬率%_月'] = df_label['報酬率%_月'].apply(lambda x: 1 if x>0 else 0)
df_label.rename(columns={'證券代碼':'證券碼'}, inplace=True)
data = pd.merge(df , df_label, on=['證券碼', '年月'])
X, y = data.iloc[:,2:-1],data.iloc[:,-1]
X_train, X_test, y_train, y_test = train_test_split(X, y, test_size=0.2)
from xgboost import XGBClassifier
from sklearn.metrics import accuracy_score
Name the classifier “model”, the following string means that we have changed the label to the encoding we want by ourselves.
model = XGBClassifier(use_label_encoder=False)
Start training!
model.fit(X_train, y_train)
Let’s check the prediction accuracy of this model on the test set
y_pred = model.predict(X_test)
predictions = [round(value) for value in y_pred]
accuracy = accuracy_score(y_test, predictions)
print("Accuracy: %.2f%%" % (accuracy * 100.0))

df_pred = tejapi.get('TWN/AFF_RAW',
                coid = '2330',
                mdate={'gte': '2015-12-01', 'lte':'2017-11-30'},
                opts={'columns': 如文章第一段}
                chinese_column_name = True,
                paginate = True)
df_pred_label = tejapi.get('TWN/APRCM',
                coid = comp,
                mdate={'gte': '2016-01-01', 'lte':'2017-12-31'},
                opts = {'columns':['mdate','roi']},
                chinese_column_name = True,
                paginate = True)
pred2 = model.predict(df_pred.iloc[:,2:])
df_pred_label['報酬率預測'] = pred2
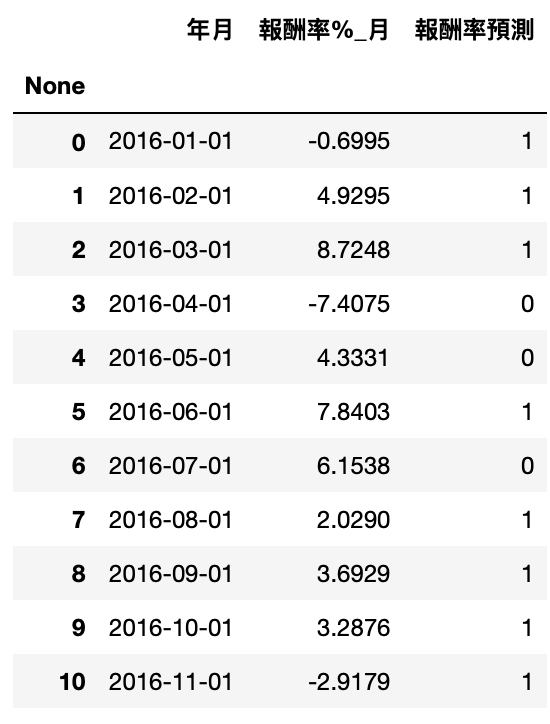
accuracy = accuracy_score(df_pred_label['報酬率%_月'].apply(lambda x: 1 if x>0 else 0), pred2)
print("Accuracy: %.2f%%" % (accuracy * 100.0))

import matplotlib.pyplot as plt
import matplotlib.font_manager
plt.rcParams['font.sans-serif'] = 'Arial Unicode MS'
plt.rcParams['axes.unicode_minus'] = False
plt.figure(figsize=(30,10))
xgb.plot_tree(model,num_trees=0)
plt.rcParams['figure.figsize'] = [1300, 1000]
plt.show()
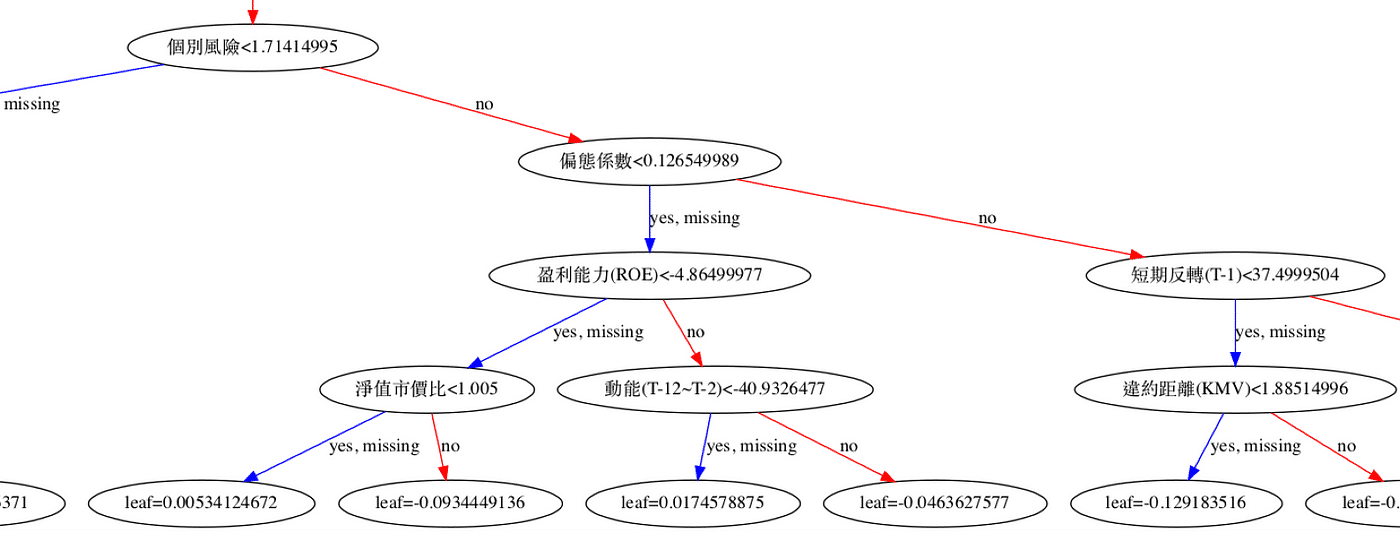
plt.figure(figsize=(10,40))
xgb.plot_importance(model)
plt.rcParams['figure.figsize'] = [5, 5]
plt.show()
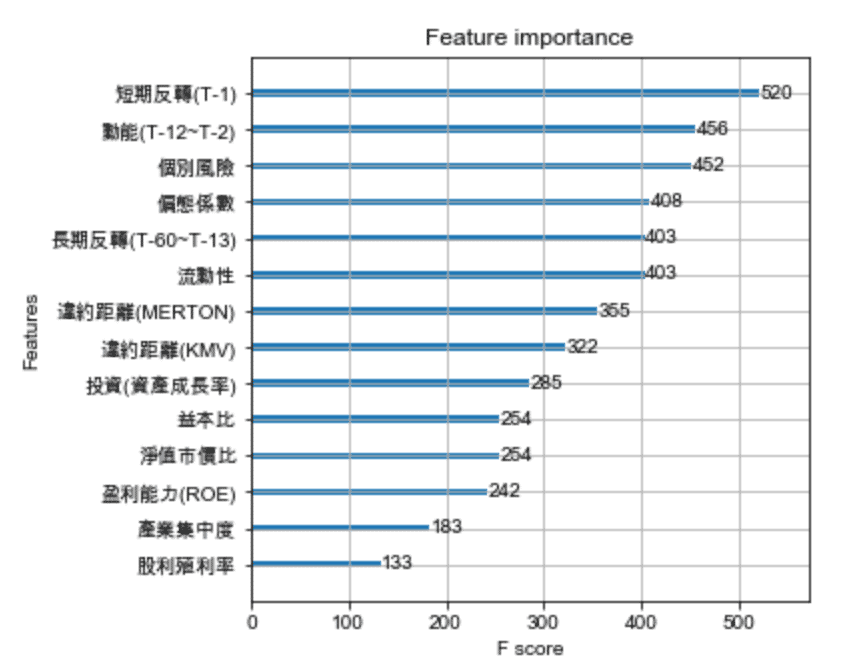
Today’s teaching is actually the common architecture of the current machine learning competition. The development of the model is actually very complicated mathematics, and we can understand its characteristics and performance to use it, and there is no need to deeply understand his mathematical calculations, unless you are right This is very interesting. Regarding the accuracy of prediction, the key is often in the pre-processing of data, including data processing such as missing values, skew states, and collinearity, or discovering from related papers that effective features can be combined.
In this article, because TEJ has sorted out the data of related factors, it is relatively easy to pre-process, but it is still important to emphasize that due to the large amount of uncertainty in finance, the current accuracy cannot represent the future accuracy. But it is understandable that these factors are the characteristics of the current financial search for stock prices, but there are a lot of data in real life that can be used to play, now hurry up and throw the data into XGBoost!
This article is for reference only, and does not constitute an offer, solicitation or invitation, inducement, any representation of any kind or form, or the conclusion of any suggestions and recommendations. Readers are advised to use their personal independent thinking skills to make investment decisions on their own, if relevant The suggestion incurs losses and has nothing to do with the author.