
Table of Contents
Peter Lynch is a legendary figure in the American mutual fund industry. From 1977 to 1990, he served as the manager of the Fidelity Magellan Fund, during which time the fund’s assets grew from $20 million to $14 billion, achieving an impressive annualized return of 29.2%. He is widely regarded as one of the most successful fund managers in history. Beyond his remarkable performance, Lynch is also known for his accessible investment philosophy, which has inspired countless individual and professional investors.
Lynch advocates the principle of “invest in what you know,” believing that individual investors have the advantage of observing the world around them and can often identify promising companies before their fundamentals are reflected in stock prices. He also emphasizes that stock selection should be based on a company’s profitability, growth potential, and financial stability. Using indicators such as the price-to-earnings (P/E) ratio and earnings per share (EPS) growth, Lynch aimed to uncover “undervalued growth stocks.”
Peter Lynch’s investment philosophy—buying companies with solid fundamentals, can his strategy be effectively applied in Taiwan’s market environment?
To explore this, we translate his core principles into a systematic screening approach and apply it to a broad universe of Taiwan-listed stocks using TEJ’s point-in-time quantitative database. Below is a breakdown of our investment universe, data preparation, screening logic, and portfolio construction:
📌 All data undergoes cleaning and standardization to eliminate survivorship bias, forward-looking errors, and incomplete entries by TEJ Quantitative Investment Database
The core of Peter Lynch’s stock-picking philosophy lies in identifying companies that exhibit both growth and value characteristics, rather than relying on market timing or macroeconomic forecasts. His investment approach emphasizes deeply understanding individual businesses—what he called “kicking the tires”—and using fundamental analysis to identify attractive investment opportunities. To translate his philosophy into a concrete framework, this strategy transforms Lynch’s core financial principles into five quantitative screening criteria:
Excessive leverage is often the source of financial risk for companies. Lynch stressed investing in financially sound firms to reduce debt repayment pressure during economic downturns or interest rate hikes. By setting a maximum debt ratio (total liabilities / total assets) of 25%, the strategy filters out highly leveraged firms and ensures that selected stocks possess strong solvency and long-term viability.
A company’s cash level reflects its short-term liquidity and operational flexibility. Lynch favored companies with ample cash reserves that could comfortably manage long-term liabilities. This strategy uses net cash per share as the metric and requires it to be above the industry average, highlighting firms with stronger capital structures and greater flexibility in operations.
Lynch valued a company’s ability to generate real cash over its accounting profits. This strategy evaluates valuation using the price-to-free-cash-flow ratio (stock price divided by free cash flow per share, where free cash flow is operating cash flow minus capital expenditures). A lower P/FCF than the industry average suggests the company is undervalued despite strong cash-generating ability—an ideal candidate for value investing.
Operational efficiency is another key criterion in Lynch’s stock selection. If inventory grows faster than revenue, it may indicate weak sales or declining demand. Conversely, when revenue outpaces inventory growth, it suggests sound sales performance and effective inventory management. This condition helps identify financially healthy firms with low inventory risk.
This strategy combines a company’s 1-year average net income growth rate and dividend yield, then divides the sum by its price-to-earnings ratio (P/E). A result of 2 or above is required. This criterion ensures that only companies with strong earnings growth, stable dividends, and reasonable valuations are included in the portfolio.
We backtested the strategy from January 2018 to April 2025 to evaluate how Peter Lynch’s investment philosophy performs in the Taiwan market. The results suggest that a growth-at-reasonable-price (GARP) approach can indeed generate solid long-term returns when applied with disciplined screening.
| Performance Metric / Strategy | Market (Benchmark) | Peter Lynch-Inspired Strategy |
|---|---|---|
| Annualized Return | 13.598% | 15.508% |
| Cumulative Return | 145.974% | 176.705% |
| Annualized Volatility | 18.44% | 21.49% |
| Sharpe Ratio | 0.78 | 0.78 |
| Calmar Ratio | 0.48 | 0.55 |
| Maximum Drawdown During Period | -28.553% | -28.022% |
Compared to the benchmark, the strategy shows consistent outperformance while maintaining a moderate correlation with the broader market. Though it experiences market fluctuations, the selected stocks demonstrate strong recovery momentum, thanks to solid fundamentals and valuation support.
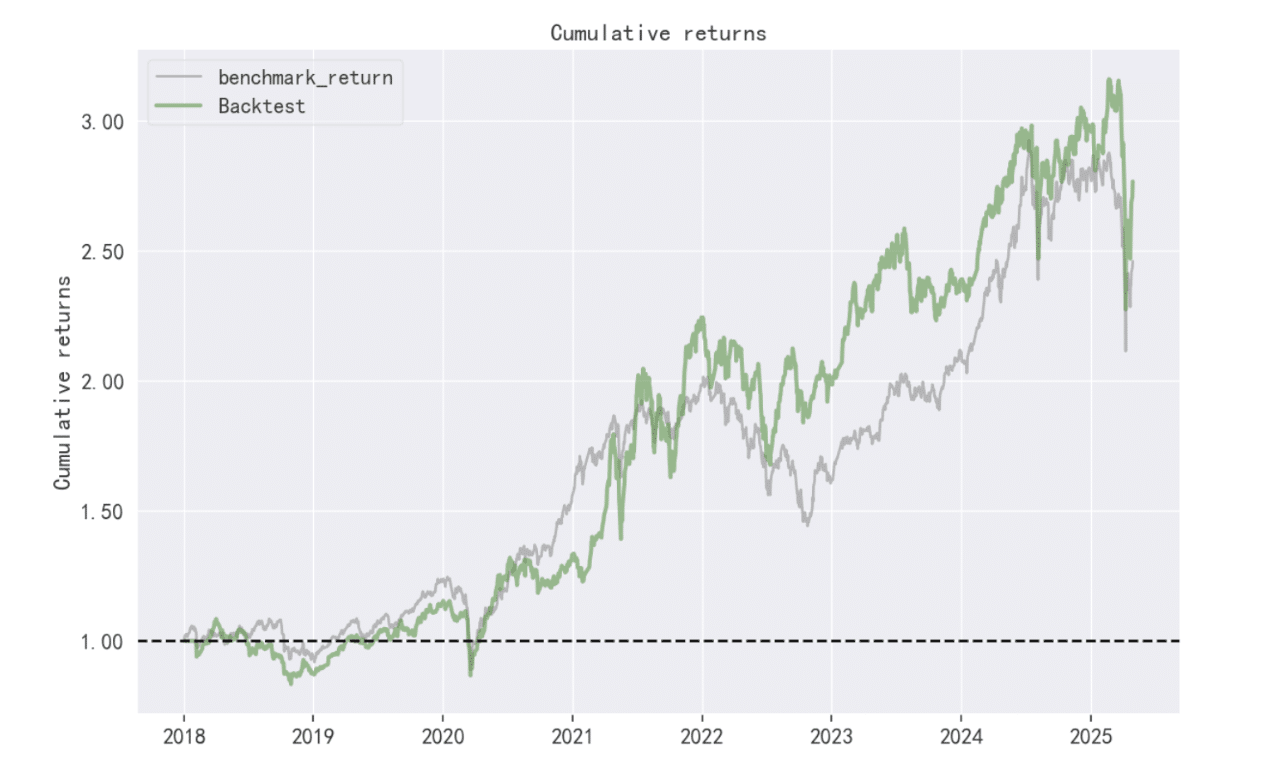
The equity curve reveals stable upward growth over time, and the drawdown chart confirms that the portfolio remains resilient even during market corrections.
⚠️ Disclaimer: This analysis is for reference only and does not constitute investment advice.
“Taiwan stock market data, TEJ collect it all.”
The characteristics of the Taiwan stock market differ from those of other European and American markets. Especially in the first quarter of 2024, with the Taiwan Stock Exchange reaching a new high of 20,000 points due to the rise in TSMC’s stock price, global institutional investors are paying more attention to the performance of the Taiwan stock market.
Taiwan Economical Journal (TEJ), a financial database established in Taiwan for over 30 years, serves local financial institutions and academic institutions, and has long-term cooperation with internationally renowned data providers, providing high-quality financial data for five financial markets in Asia.
With TEJ’s assistance, you can access relevant information about major stock markets in Asia, such as securities market, financials data, enterprise operations, board of directors, sustainability data, etc., providing investors with timely and high-quality content. Additionally, TEJ offers advisory services to help solve problems in theoretical practice and financial management!
The Wisdom of Blue-Chip Stocks: Howard Rosman’s Prudent Path to Wealth
Charles Brandes’ Value Investing Principles : Building a Portfolio with a Margin of Safety
From Business Cycle Indicators to Asset Rotation: A Quantitative Strategy to Avoid Bear Markets
