
In the landscape of modern finance, investors are relying more on quantitative models and data-driven strategies rather than intuition, reshaping how investment decisions are made. One of the key indicators that help quantitative investors identify potential market outperformance is alpha signals. As such, we’ll explain what alpha signals are, how they work, and how investors apply them for effective trading strategies.
Table of Contents
Alpha (α) represents the returns that exceed relevant benchmarks, such as the S&P 500, independent of overall market movements. It is also one of five key technical investment risk ratios in modern portfolio theory; the others include beta, standard deviation, R-squared, and the Sharpe ratio.
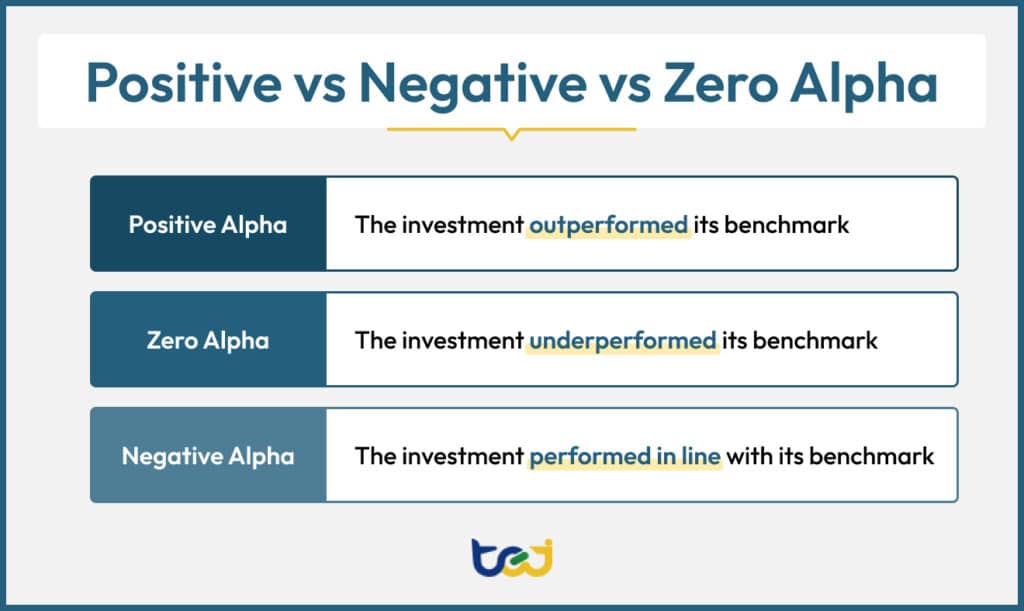
In essence, alpha helps investors assess the effectiveness of active investment strategies. For instance, a positive alpha means that a portfolio has outperformed its benchmark on a risk-adjusted basis, suggesting skillful management.
On the other hand, a negative alpha means the investment underperformed relative to the market, potentially reflecting inefficiency or poor strategy execution.
There may even be zero alpha, which means the investment performed in line with its benchmark, indicating that the portfolio matched expectations as it neither added nor lost value beyond general market movements.
The basic formula for alpha is:
Alpha = Portfolio Return – Benchmark Return
A more refined method is Jensen’s Alpha, which accounts for risk using the Capital Asset Pricing Model (CAPM):
Alpha = rp – [rf + β × (rm – rf)]
Where:
An alpha signal is a data-driven metric or model that aims to identify opportunities for generating alpha, acting as predictive indicators for future returns. These signals can be derived from various sources, including fundamental analysis of a company’s financials, technical analysis of market trends, and advanced quantitative models that process a wide range of financial data.
Alpha signals are diverse and can be categorized by their data source. Common examples include:
Some investors may leverage resources like TEJ’s Factor Library or S&P’s Global Alpha Signal Library to identify potential alpha signals. You can explore these solutions by clicking on the button below.
Alpha and beta are the two most widely used performance and risk metrics in finance. While both relate to benchmarking against the market, they serve distinct purposes.
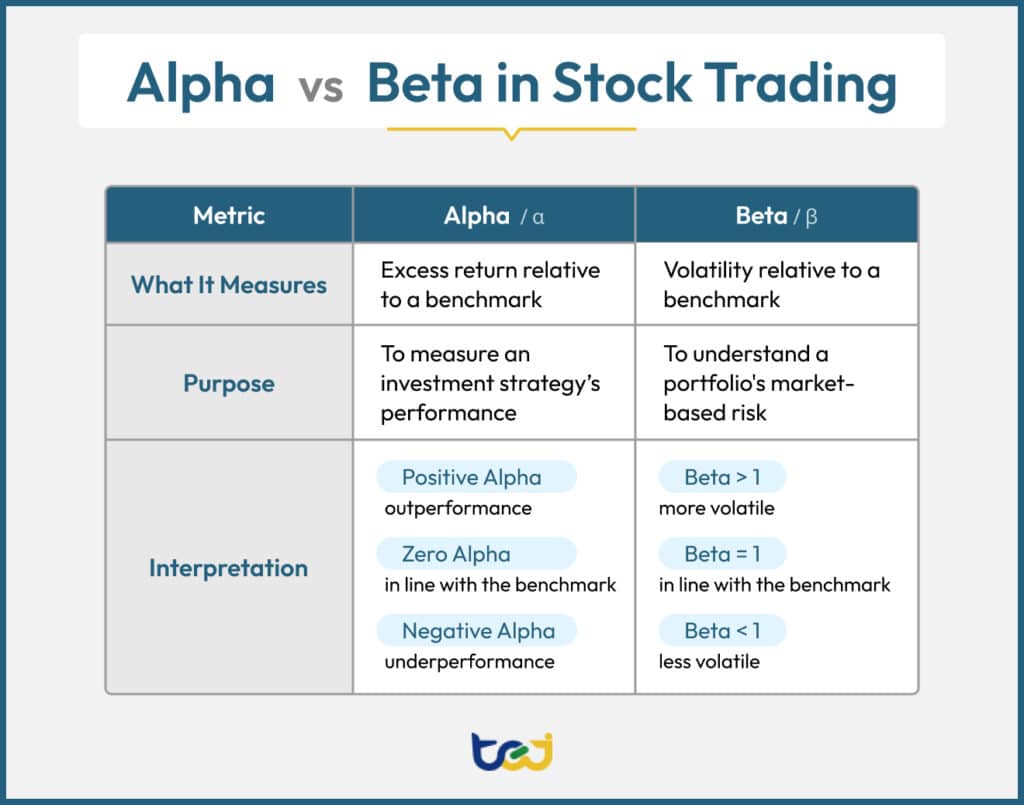
As we’ve discussed, alpha measures how much an investment has outperformed or underperformed its benchmark. It is typically used to evaluate the effectiveness of portfolio management strategies, with positive alpha implying outperformance and negative alpha signaling underperformance.
In contrast, beta quantifies an investment’s volatility relative to the market. A beta of 1.0 means the asset generally moves in line with the market. A beta above 1 indicates greater volatility than the market, while a beta below 1 means the investment is less volatile. Unlike alpha, beta reflects risk exposure, not performance.
Beyond alpha and beta, several other Greek letters are used in finance. Here’s a quick reference guide:
| Greek Letter | Key Use | Measures | Interpretation |
| α / Alpha | Performance Analysis | Excess return compared to a benchmark | Positive = outperformance; negative = underperformance |
| β / Beta | Risk Assessment | Volatility relative to the market | >1 = more volatile; <1 = less volatile |
| Δ / Delta | Options Pricing | Change in option price per $1 change in the underlying asset | 0 to 1 for calls;-1 to 0 for puts; |
| Γ / Gamma | Options Risk | Change in delta per $1 change in the underlying asset | Higher gamma = greater sensitivity to price movements |
| Θ / Theta | Time Decay in Options | Loss in option value as time passes | Higher theta = faster time value decay (usually negative) |
| ν / Vega | Volatility Sensitivity | Change in option price per 1% change in implied volatility | Higher vega = more affected by volatility shifts |
| ρ / Rho | Interest Rate Sensitivity | Change in option price per 1% change in interest rates | Higher rho = more responsive to interest rate changes |
| ε / Epsilon | Statistical Analysis | Unexplained variation in a regression model | Represents error terms to capture residuals or unknown variables |
| λ / Lambda | Option Elasticity | Percent change in option price vs. percent change in asset | Higher lambda = more responsive to underlying asset moves |
| Ω / Omega | Risk/Reward Assessment | Ratio of expected gains to expected losses | Higher omega = more favorable risk-adjusted return potential |
Alpha signal generation is a multi-step process that relies on advanced quantitative methods to extract actionable insights from market data.
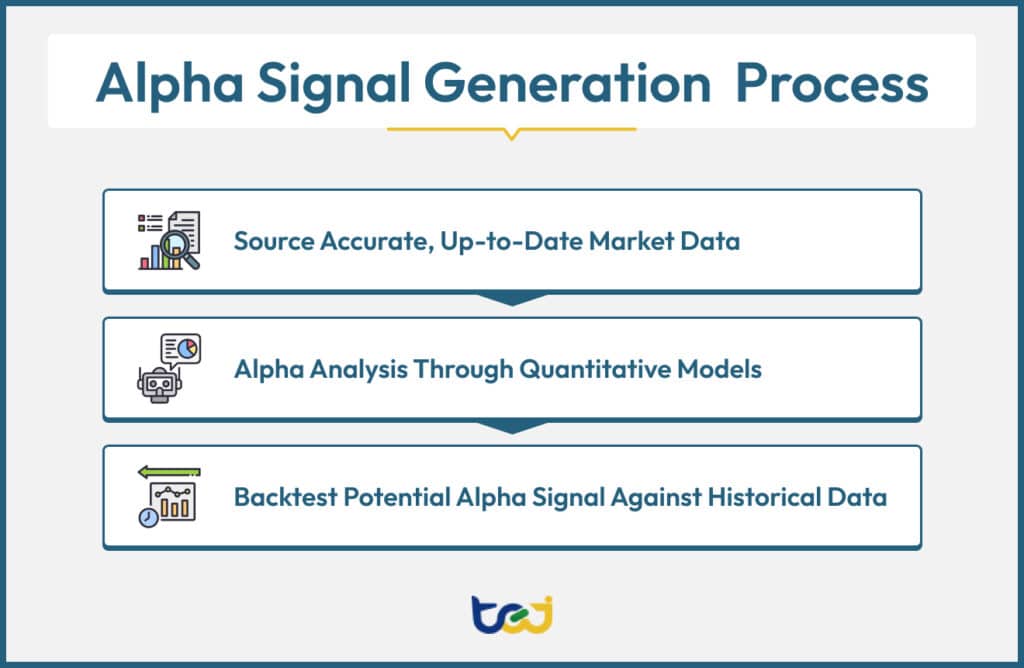
The foundation of any alpha signal lies in high-quality data. Traders and quants begin by feeding both traditional financial data (e.g., earnings reports, debt ratios, cash flows, and valuation multiples) and alternative data (e.g., credit card transactions, web traffic, social media sentiment, and satellite imagery) into their analysis pipelines. These diverse data inputs offer a broader view of company and market behavior, helping uncover non-obvious opportunities.
However, not all data is equally useful. Inconsistent, inaccurate, or low-frequency data can lead to misleading signals and poor investment outcomes. That’s why it is critical to source clean, accurate, and consistent data from reliable providers like TEJ, as a high signal-to-noise ratio and timeliness further enhance the predictive potential of any alpha-generating model.
Follow the link below to dive deeper into how TEJ powers global investment decisions with trusted Taiwanese market data.
Once relevant data is gathered, algorithmic models are used to detect patterns and anomalies through quantitative data analysis. Rather than trying to directly predict stock prices, these models often focus on identifying combinations of features or market behaviors that correlate with future outperformance, forming the basis for alpha signals.
Although traditional statistical techniques (e.g., regression analysis or z-scores) are still common, machine learning (ML) has become more widespread for alpha analysis since it can identify complex nonlinear relationships and interaction effects between variables that conventional models may miss. So, it’s best to choose models or tools that will continuously adapt to changing market conditions and learn over time, allowing for future-proof strategies.
After a potential alpha signal is developed, it must be backtested against historical data to determine its effectiveness. This process involves simulating trades using past market data to measure the signal’s predictive accuracy, Sharpe ratio, drawdowns, and risk-adjusted returns.
Backtesting helps separate genuine predictive power from random chance. It also reveals how the signal behaves across market regimes, asset classes, or geographies, offering essential insights before deploying real capital. This gives investors the confidence needed to move from theoretical predictions to a live trading strategy.
Investors usually use alpha signals to support systematic trading strategies or build ranking-based portfolios. Let’s delve deeper into these two common approaches:
Systematic trading is a passive, rule-based quantitative strategy that relies on pre-defined alpha signals to make all trading decisions. The process can be fully automated through trading algorithms that scan for signals, execute trades, and adjust positions in real time, with minimal human intervention. This enhances consistency, eliminates emotional bias, and allows for scalability across large datasets and multiple asset classes.
In many cases, investors don’t rely on a single signal but instead combine multiple alpha signals into factor-based strategies, creating a diversified portfolio with momentum, value, quality, sentiment-based signals, and more.
Nevertheless, it is important to note that systematic trading doesn’t guarantee outperformance, but it still appeals to both retail investors and institutional quant funds alike due to its transparent and disciplined framework.
Alpha signals are often used to rank active mutual funds based on their historical risk-adjusted performance relative to a benchmark. The alpha values are typically expressed as percentages, allowing investors to compare funds in a standardized way. For example, a fund with an alpha of +3.0 has delivered 3% more return than expected for its level of risk.
By ranking funds this way, investors can construct portfolios that allocate more capital to top-performing funds with higher alpha. This helps maximize expected returns while still managing portfolio risk, especially when combined with other risk metrics like beta or standard deviation.
Investors must carefully navigate the challenges of index suitability, signal degradation, and data issues to use alpha signals effectively.
Alpha is only meaningful when a portfolio is compared to an appropriate benchmark. Using a mismatched index, such as comparing an equity fund to a bond index, can result in misleading conclusions. This means ensuring alignment between the investment and its benchmark is essential for accurate alpha evaluation.
As markets become more efficient, once-profitable signals may lose their predictive power. This is particularly relevant in competitive environments where widespread adoption of a signal leads to its rapid decay. Thus, regular backtesting and adaptive strategies are needed to keep signals relevant.
Many alpha signals suffer from data issues, such as overfitting, which occurs when a model is overly tailored to historical data, capturing noise instead of meaningful trends. There is also a risk of data snooping, which happens when too many variables are tested, increasing the risk of false positives.
This once again highlights the importance of having accurate, clean, and up-to-date data. Without high-quality data, even the most sophisticated quantitative models can produce flawed signals.
TEJ is a trusted financial data provider offering institutional-grade datasets that empower investors to uncover and validate alpha-generating strategies. Our Quantitative Investment Database is built specifically for Taiwan’s equity market and integrates extensive data from three key areas: market activity, company fundamentals, and corporate events.
Designed with a point-in-time structure, TEJ’s database also accurately reconstructs the information available at any historical moment. This is an essential feature for eliminating hindsight bias and enabling realistic backtesting.
Moreover, TEJ supports a wide range of alpha strategies through tools such as event-driven data (e.g., dividend changes, M&As), institutional trading flows, and multi-frequency datasets that work across both high-frequency and long-term models.
Whether you’re developing short-term signals or building a fundamental long-only portfolio, TEJ provides the data accuracy, depth, and timeliness needed to generate and sustain alpha. Explore our solutions today!
