
Table of Contents
In the previous study : Factor Research –Capital Gain Overhang | Part 1, we examined the Capital Gain Overhang (CGO) factor, designed to capture the behavioral bias known as the Disposition Effect. By measuring the gap between current market prices and investors’ average cost basis, CGO quantifies unrealized gains and losses at the market level. Empirical tests in Taiwan’s equity market confirmed that CGO is a meaningful predictor of future returns: high-CGO stocks consistently outperformed low-CGO stocks, generating significant positive alpha beyond standard Fama–French models, especially over medium- to long-term horizons.
👉Part 1:Factor Research-Capital Gain Overhang.
To evaluate the practical performance of CGO, we construct and backtest three types of strategies. The first is a pure CGO factor strategy, serving as the baseline. The other two are enhanced versions that combine CGO with low-risk filters. These enhanced strategies adopt a Sequential Sort approach: first applying a low-risk filter to narrow the investment universe, and then ranking the remaining stocks by CGO to select the final portfolio.
👉What is Idiosyncratic Volatility, how does it works in factor investing?
「Every 5 months, stocks are ranked by the factor rules, and the top 50 are selected into the portfolio.
Table 1: Backtest Performance of Factor Strategies
| cgo | cgo_low_tv | cgo_low_ivol | Benchmark | |
|---|---|---|---|---|
| Annual return | 14.89% | 14.04% | 13.57% | 10.74% |
| Cumulative returns | 1502.49% | 1281.51% | 1173.04% | 668.12% |
| Annual volatility | 16.45% | 8.46% | 9.23% | 18.38% |
| Sharpe ratio | 0.927 | 1.596 | 1.425 | 0.647 |
| Max drawdown | -57.29% | -32.91% | -35.54% | -56.02% |
| Sortino ratio | 1.257 | 2.165 | 1.936 | 0.898 |
| Alpha | 0.080 | 0.096 | 0.086 | |
| Beta | 0.631 | 0.361 | 0.410 |
Figure 2: Cumulative Returns of Factor Strategies
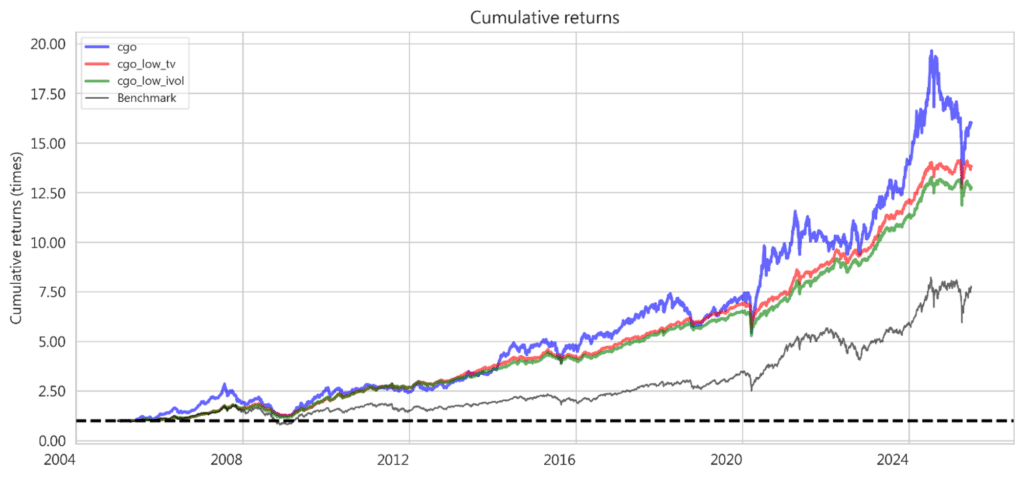
We first examine the Pure CGO strategy Backtest results show that the strategy delivers an annualized return of 14.9%, significantly outperforming the market benchmark (10.7%). However, this outperformance comes with notable risks: annualized volatility of 16.5% and a maximum drawdown of –57%, only slightly better than the market. The Sharpe ratio of 0.93 indicates a reasonable level of risk-adjusted performance, but there remains substantial room for improvement.
In short, the pure CGO strategy confirms that the factor generates strong alpha, but its standalone application exposes investors to considerable volatility and downside risk.
To improve the risk–return profile, we combine CGO with low-risk factors using a Sequential Sort approach.
Beyond risk reduction, both enhanced strategies demonstrate a dual advantage of alpha purification and beta reduction. Compared with the pure CGO approach, their beta values fall sharply (0.63 → 0.36 for cgo_low_tv; 0.41 for cgo_low_ivol), while alpha remains high or even improves (0.096 for cgo_low_tv; 0.086 for cgo_low_ivol). This indicates that risk filters not only control volatility but also help CGO isolate more stable and genuine sources of excess return.
Together, the results highlight that adding low-risk filters significantly improves portfolio robustness. Among the two enhanced versions, the cgo_low_tv strategy shows the most balanced performance, suggesting that historical volatility is a more effective complementary screen than idiosyncratic volatility.
This study conducts a systematic examination of the Capital Gain Overhang (CGO) factor in Taiwan’s equity market. The results show that CGO is an effective behavioral factor: while it offers strong excess returns, it also comes with elevated volatility. When combined with low-risk factors, however, its risk-adjusted performance improves significantly.
A pure CGO strategy generates an annualized return of around 15%, but with volatility as high as 16%. In contrast, the sequential-sorting strategy cgo_low_tv (filtering first by low volatility, then ranking by CGO) reduces annualized volatility to 8.5%, while raising the Sharpe ratio from 0.93 → 1.60. These improvements are both statistically and economically significant.
Overall, the findings confirm that CGO is a valid source of excess return. More importantly, applying CGO within a risk-controlled portfolio framework allows investors to capture its value in practice while maintaining portfolio stability.
The TEJ Factor Library provides over 100 standardized alpha factors—including IVOL, momentum, valuation, and quality—built with point-in-time methodology for clean backtests. Combined with TEJ Market & Financial Data, it enables seamless:
📩Explore how CGO and other factors perform in your portfolio universe?
Visit TEJ Factor Library or contact us to request a custom factor analysis demo.