
Table of Contents
In the field of investing, business cycles have always served as an important reference. Whether it’s fluctuations in the macroeconomy or the ups and downs of corporate earnings, these cycles play a crucial role. Charles Brandes, a distinguished disciple of Benjamin Graham, founded Brandes Investment Partners in 1974 and has since grown its assets under management from $130 million to over $75 billion. The firm’s Brandes Global Equity Fund achieved an impressive 20-year annualized return of 17.91%, significantly outperforming the MSCI World Index, and has received Morningstar’s five-star rating and numerous international awards. Another flagship product, the AGF International Value Fund, has also demonstrated outstanding long-term performance. Brandes himself has been repeatedly ranked among the world’s top fund managers.
A steadfast adherent to the principles of value investing, Brandes rejects the use of forward-looking forecasts as the basis for stock selection. Instead, he emphasizes investing with a “margin of safety” and focusing on the intrinsic value of companies, following a medium- to long-term holding strategy. To faithfully reflect his investment philosophy, this study seeks to quantify Brandes’ approach by using a company’s net asset value in place of traditional discounted cash flow models, and builds a backtesting framework to evaluate the strategy’s performance in historical market data. This article introduces the data processing procedures, backtest design, and performance analysis, aiming to demonstrate the feasibility and robustness of Brandes-style value investing within a quantitative framework.

Margin of Safety : This refers to the cushion when an asset’s intrinsic value exceeds its market price. The concept highlights that even if future business conditions or market environments turn unfavorable, the risk of loss is mitigated because the asset was purchased at a sufficiently low price.
Backtesting Period:
From January 1, 2020, to April 21, 2025
(Set to ensure access to at least 5 years of historical financial data prior to each rebalancing)
Data Collection Period:
From 2013 to 2025 (10+ years of historical data for reliable evaluation)
Stock Pool:
All listed companies on the Taiwan Stock Exchange (TWSE) and the Taipei Exchange (TPEx)
(Only includes firms with complete financial data from 2013 onward)
Benchmark:
TAIEX-Total Return Index ( IR0001 )
Data Source:
Extract the necessary data for Charles Brandes’ stock selection criteria, such as: P/E Ratio, insider holdings, stock prices from TEJ Financial Data and TEJ Market Data
Simulation Method:
Backtests are performed only on firms that meet data quality and completeness requirements, to maintain the rigor of performance evaluation.
Rebalancing Dates:
The portfolio is rebalanced every 60 trading days.
This strategy aims to select stocks that exhibit solid financial structures, substantial insider ownership, and low market valuations—ensuring a margin of safety. The specific screening criteria are as follows:
In practice, stocks meeting the above criteria are selected and purchased using an equal-weighted allocation. These holdings are maintained until the next rebalancing date. Given that this is a value investing strategy—which typically requires a longer time horizon for prices to reflect intrinsic value—the portfolio is rebalanced every 60 trading days.
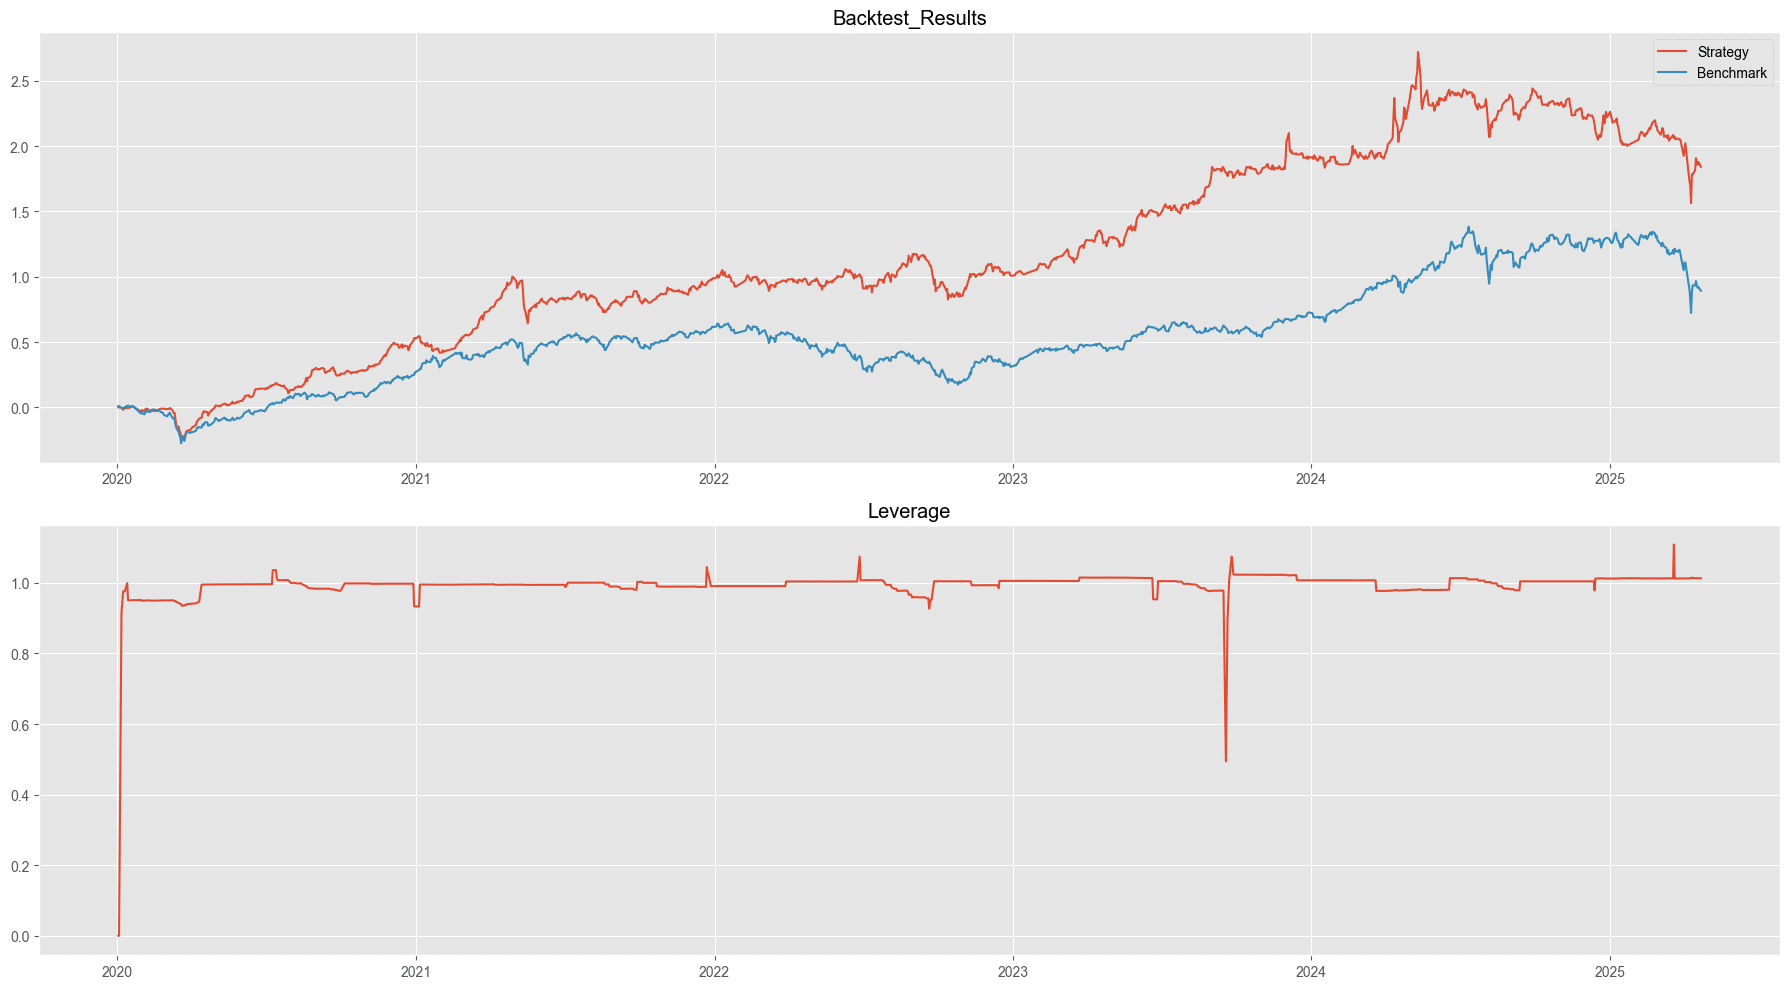
The strategy achieved an annualized return of 23.75%, significantly outperforming the market benchmark, which recorded only 15% over the same period. The Sharpe ratio of the strategy is 1.15, indicating that for every unit of risk taken (after deducting the risk-free rate), the strategy delivered 1.15 units of excess return.
Results from the CAPM regression show an alpha of 0.15 (i.e., 15% annualized), demonstrating the strategy’s consistent ability to generate excess returns. The beta is 0.61, suggesting that the portfolio’s sensitivity to market movements is only about half that of the broader market, offering substantial diversification benefits.
Examining the cumulative return curve, the strategy widened its lead over the benchmark from late 2020 to Q1 2021, primarily due to a valuation recovery in high-quality value stocks such as shipping and traditional industries. During the broad bull market from early 2023 to early 2024, value stocks also benefited from overall market momentum, allowing the strategy to maintain its outperformance. This strategy further confirms that a stock selection approach centered on the margin of safety can deliver significant advantages even in bullish market conditions.
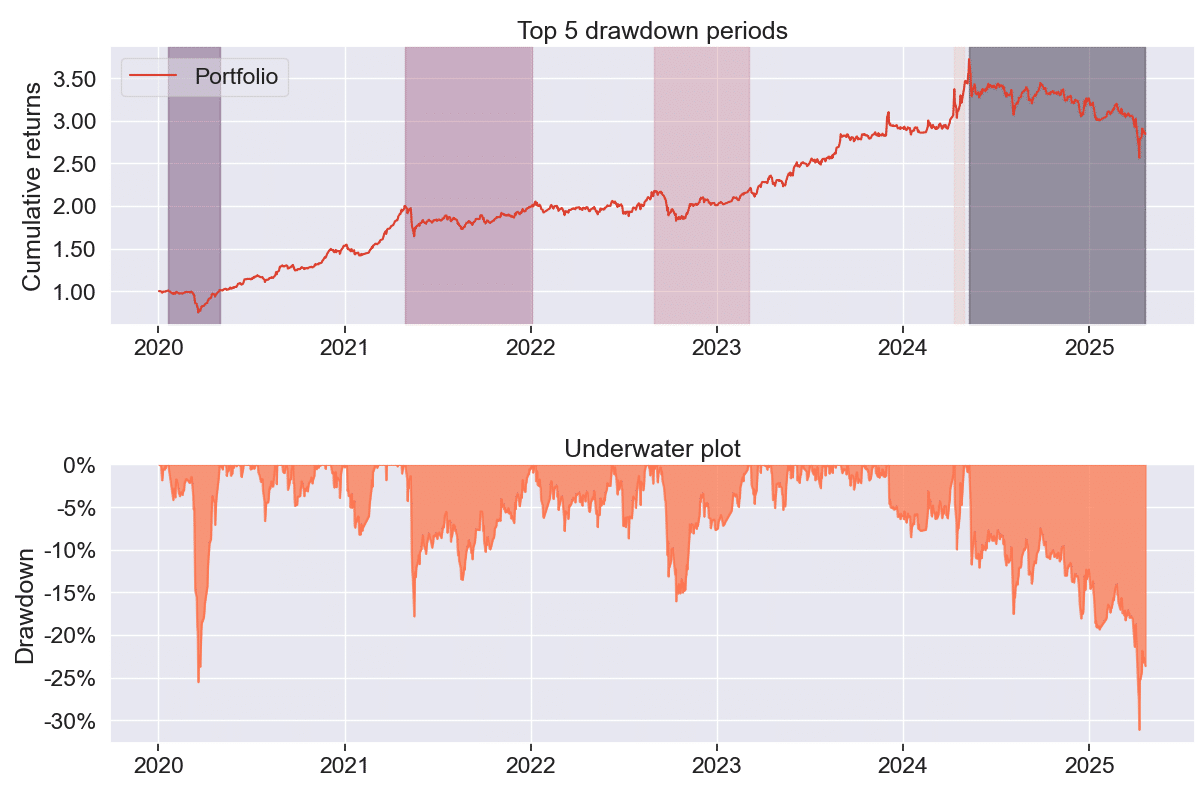
The strategy experienced multiple periods of market turbulence, including the onset of COVID-19, valuation corrections, and interest rate hikes. The five most significant drawdowns ranged from approximately −10% to −30%, with most recovering within 3 to 6 months. However, a more significant drawdown occurred between 2024 and 2025, coinciding with the final phase of a market bull run—a period that typically presents fewer opportunities for value investors. This phase also represents an opportune time to scale out of certain positions, rotate into cash or short-duration bonds, and prepare for the next investment cycle.
Behind every sound investment strategy lies robust, reliable data—and that’s exactly what TEJ delivers. For over three decades, TEJ has led financial data innovation in Taiwan, providing institutional-grade datasets tailored for quantitative research.
The Factor Library features over 100 alpha factors across value, momentum, quality, and risk dimensions—all meticulously constructed using point-in-time methodology. Each factor is standardized, comparable, and ready for direct application in ranking, screening, and multi-factor model development.
The Quantitative Investment Database offers point-in-time data spanning fundamentals, financials, market activity, and event-driven information. Designed for quantitative analysis, it empowers users to build and test investment strategies using clean, time-aligned datasets free from look-ahead bias.
With TEJ, global investors gain transparent access to Taiwan’s capital markets—transformed into structured intelligence that powers data-driven strategies.

From Business Cycle Indicators to Asset Rotation: A Quantitative Strategy to Avoid Bear Markets
