
Table of Contents
In the field of investment, the “business cycle” has always been an important reference point. Fluctuations in the overall economy, corporate earnings, and market sentiment all show distinct characteristics during different stages of the cycle. Therefore, being able to grasp the movements of the business cycle can help investors more accurately adjust their asset allocations and gain a relative advantage in the market.
In Taiwan, the government provides a simple and accessible indicator of the economic condition through the publication of the “business cycle signal lights.” These lights are categorized into five types: blue, yellow-blue, green, yellow-red, and red, each representing the current state of the economy:
This signal system is calculated by the National Development Council based on multiple economic indicators, transforming complex macroeconomic information into a form easily understood by the general public. By appropriately utilizing these indicators and validating them through quantitative investment strategies, investors can better grasp optimal entry and exit points amid the fluctuations of the economic cycle.
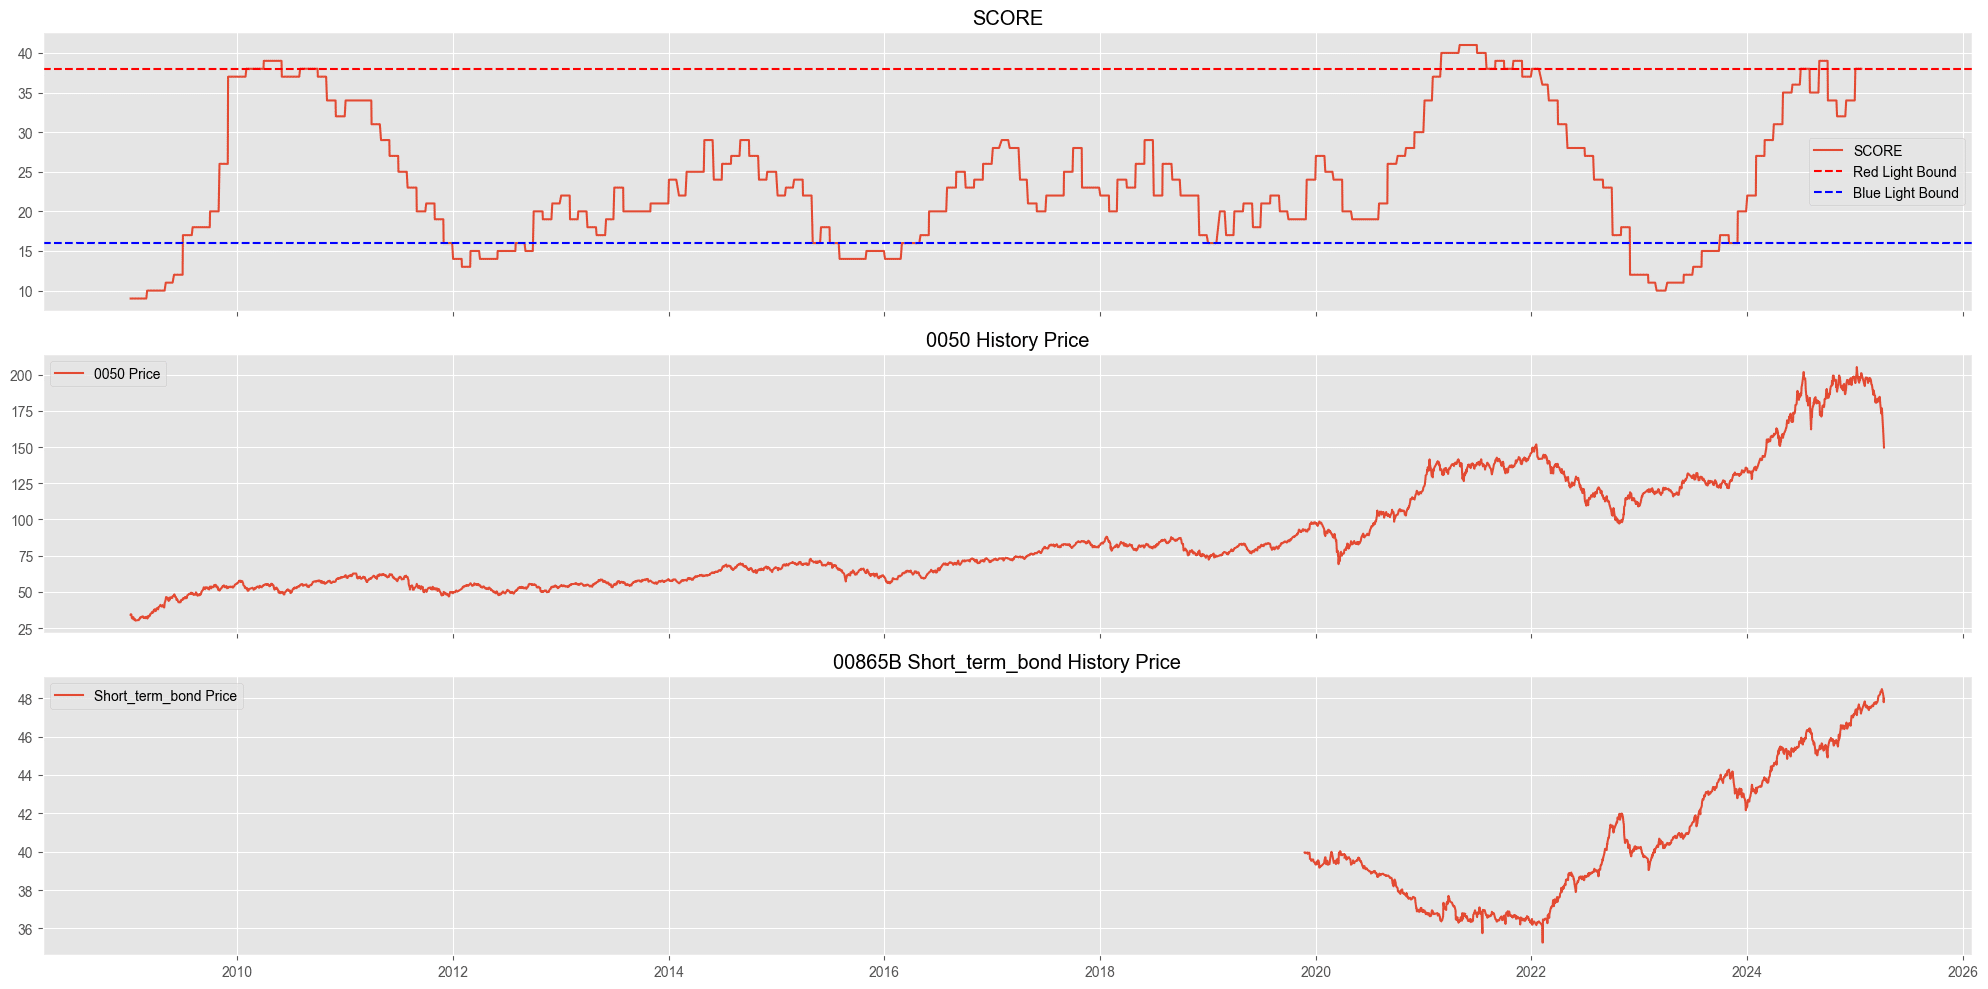
From the perspective of the business cycle, the market typically experiences a bear market every few years, leading to significant short-term asset drawdowns. We aim to extract relatively strong entry and exit signals from the business cycle indicators, allowing investors to avoid major downturns and reduce portfolio risks even when simply investing in broad market indices such as the general market or a market-cap-weighted ETF like 0050.
The trading logic proposed in this article is to buy stocks when the business signal light shows a “blue light,”suggesting a relatively low point in the economic cycle, and sell stocks when a “red light” appears, indicating potential economic overheating. Through this straightforward design, we seek to “avoid holding positions during bear markets” while capturing the major upward movements of the broad market. During periods when we are not holding stocks, we invest in a one-year U.S. Treasury bond ETF to mitigate the risk of inflation eroding the value of cash holdings.
Trading Instruments & Practical Implementation Details:
The primary trading instrument is the 0050 ETF, as it provides the most direct way for general investors to gain exposure to the Taiwanese stock market. For the bond allocation, we choose the 00865B U.S. Short-Term Treasury Bond ETF, preferring U.S. bonds because their yields are generally higher than those of Taiwanese government bonds. Short-term bonds are selected to prioritize capital preservation while earning interest income. Our goal during periods out of the stock market is simply to counter inflation.
Practical Implementation Details : Since TEJAPI provides the business cycle signal scores for Taiwan, this article uses TEJ’s business cycle indicators as the basis for backtesting.
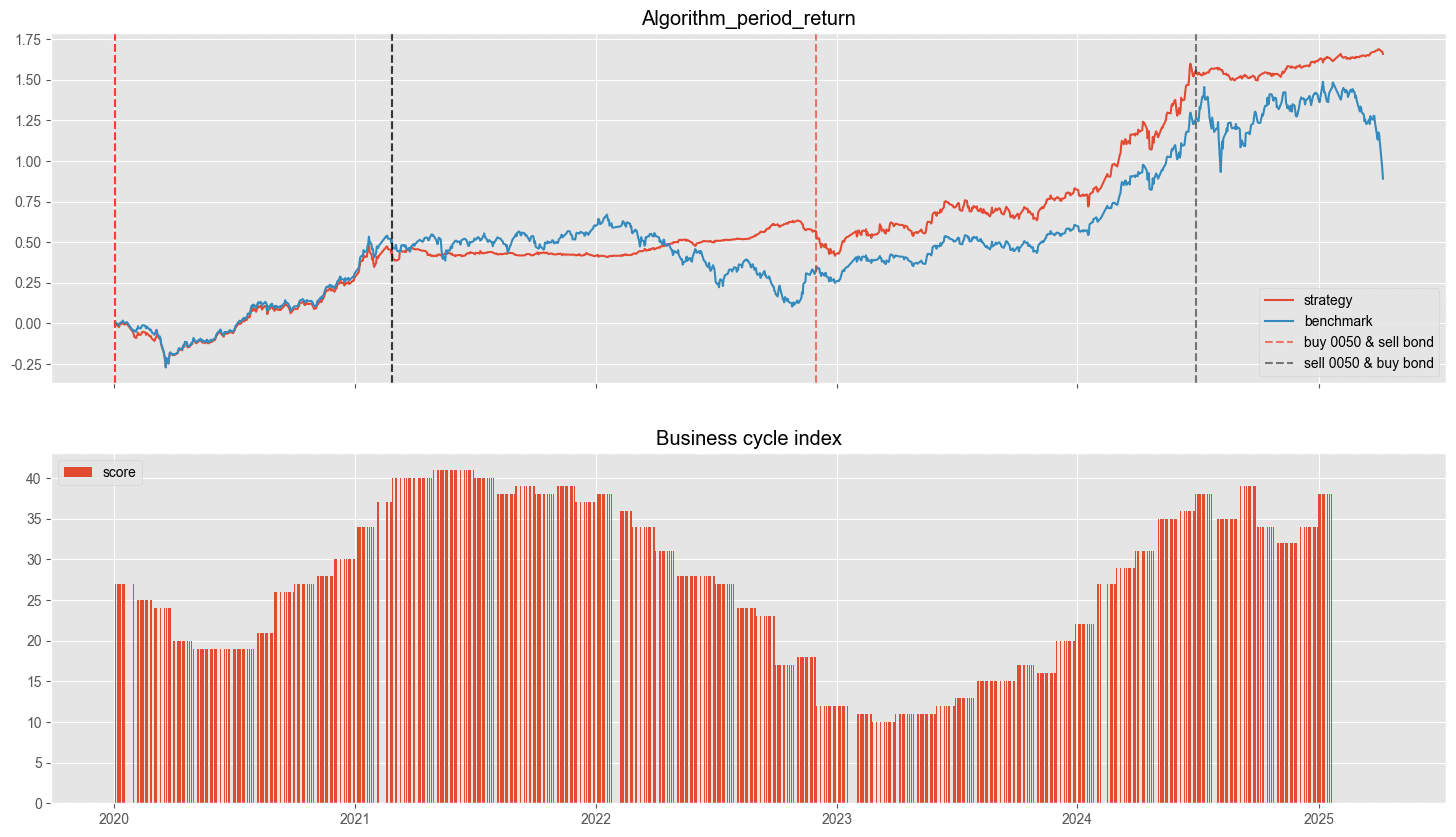
The chart above shows the cumulative return of the strategy backtest, with periods of holding 0050 and periods of holding short-term U.S. Treasuries clearly marked.
Looking at the overall performance, the strategy significantly outperforms the broad market. Even excluding the market downturn caused by the U.S. tariff policy announced in April 2025, the strategy still delivers about 25% higher returns than the market.
Digging into the details: from 2021 to the end of 2022, the market first moved sideways for about a year before entering a downturn. Over these two years, the overall market return slightly declined. During this period, the strategy was allocated to the U.S. short-term Treasury bond ETF. Although the bond returns were modest, the strategy successfully avoided the stock market’s volatility while steadily earning interest income — exactly the effect we aimed for.
Next, looking at the period around June 2024, the strategy exited 0050 and shifted into bonds. While holding bonds, the market experienced two major downturns: the first in August 2024 due to the unwinding of yen carry trades, and the second in April 2025 triggered by Trump’s tariff policies.
Although this hindsight view benefits from knowing the outcomes, we can observe that overall market valuations were already stretched during that time, and even without these policy shocks, the market likely had limited upside potential.
This strategy only uses the information from the business cycle signal lights. Investors can further enhance their own strategies by incorporating preferred economic indicators — such as the VIX, benchmark interest rates, or the Purchasing Managers’ Index (PMI) — to strengthen the market timing capability and achieve long-term stable returns.
The backtest period spans from January 1, 2020, to April 8, 2025.
The starting point of 2020 was chosen because the 00865B ETF only became available for trading at the end of 2019.
The strategy achieved a Sharpe ratio of 1.38, indicating that it delivered solid returns while maintaining good risk control.
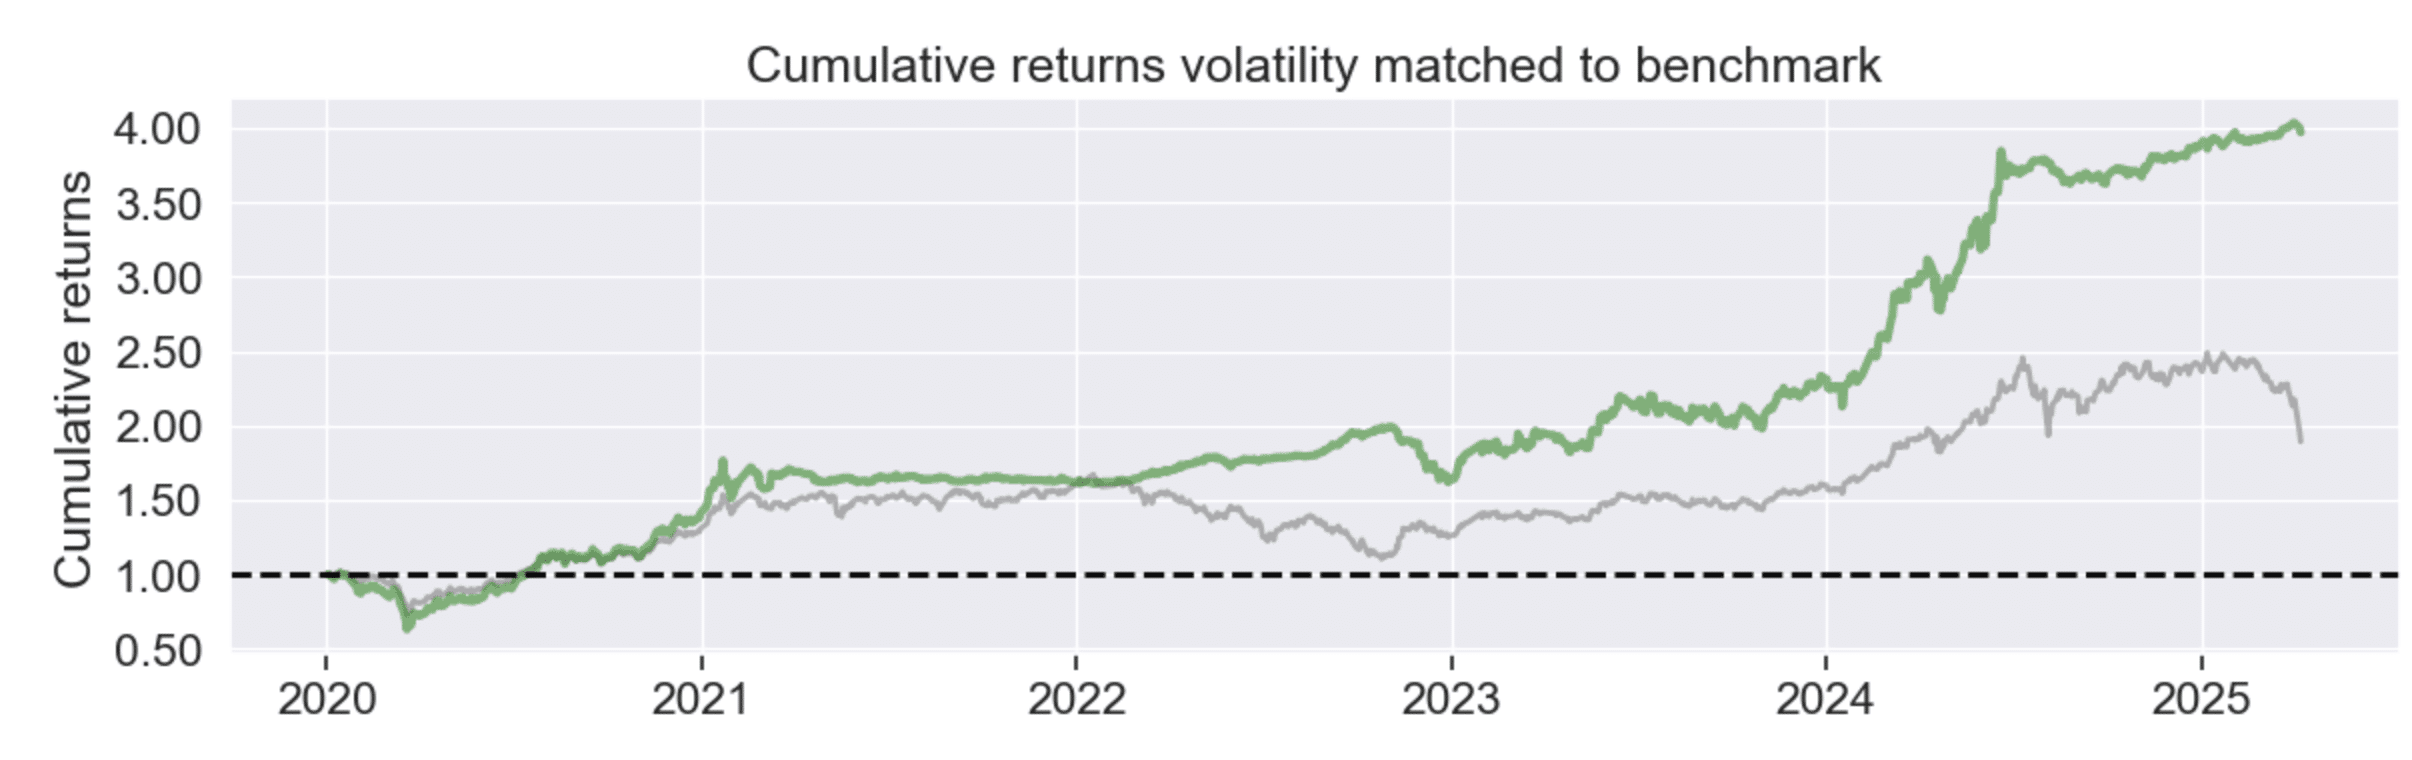
The second chart shows the cumulative returns adjusted for risk.
It is evident that the strategy experienced lower volatility during the backtest, leading to a significant gap in overall returns compared to the benchmark.
This suggests that the strategy successfully avoided periods of bear market turbulence, helping to reduce investors’ anxiety during downturns.
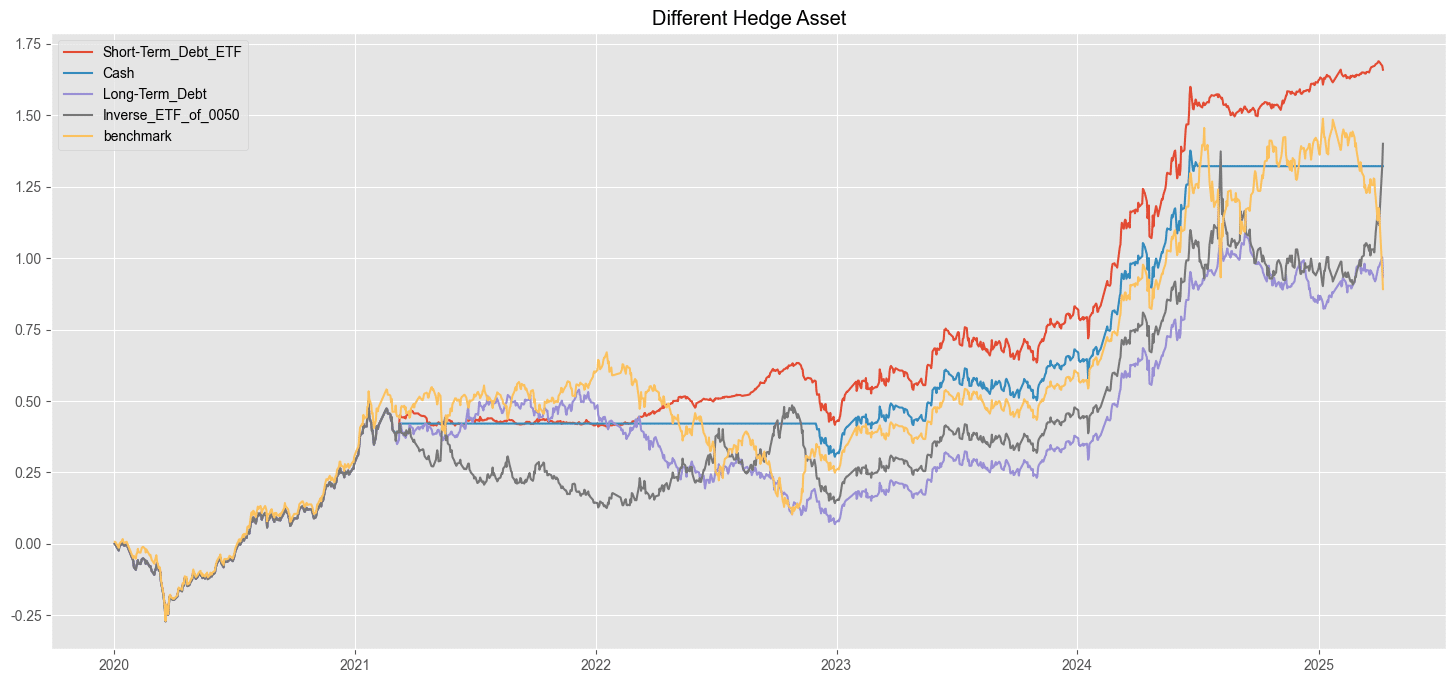
The following chart presents a comparison of strategies using different hedging assets.
The original strategy (red line) uses a short-term U.S. Treasury bond ETF.
Now, additional scenarios are included: holding cash (blue line), holding a long-term U.S. Treasury bond ETF (00687B, purple line), and using the inverse 0050 ETF (00664R, gray line).
The benchmark (yellow line) represents simply holding 0050.
The chart shows that the short-term U.S. Treasury bond ETF still delivers the best performance, followed by the inverse 0050 ETF, then cash, and lastly the long-term U.S. Treasury bond ETF.
However, this does not imply that long-term U.S. Treasury bonds are inherently weaker as a hedging asset.
Rather, their prices are influenced not only by interest rates but also by investor expectations regarding future rate hikes or cuts.
Therefore, using long-term bonds as a hedging tool would require deeper research and analysis of additional data and indicators.
The second-best performer is the inverse 0050 ETF.
However, readers should note that this strategy’s sharp short-term gain was primarily due to the tariff policy announced in April 2025.
In terms of volatility, the inverse ETF strategy shows the highest fluctuation among the four options.
Moreover, inverse ETFs often use derivatives such as futures contracts, and long-term holding can lead to profit erosion due to rollover costs — a point that investors should pay special attention to!
| Hedge Asset | Short Term Debt ETF | Long term Debt ETF | Cash | Inverse ETF of 0050 | Benchmark |
| Annual Return | 21.3% | 13.9% | 18.11% | 18.89% | 12.37% |
| Cumulative Returns | 165.9% | 93.5% | 132.2% | 140% | 80.4% |
| Volatility | 14.8% | 17.7% | 14.3% | 20.9% | 20.12% |
| Sharpe ratio | 1.38 | 0.83 | 1.23 | 0.93 | 0.68 |
| Alpha | 0.16 | 0.09 | 0.12 | 0.23 | 0 |
| Beta | 0.4 | 0.38 | 0.43 | – 0.07 | 0.92 |
In terms of Sharpe ratio, the short-term U.S. Treasury bond ETF still delivers the best performance, achieving a Sharpe ratio of 1.38 and an annualized return of 21.3%, which is an excellent result for a “market-timing” strategy.
The next best performer is cash (Sharpe ratio = 1.23), followed by the inverse ETF (Sharpe ratio = 0.93), and lastly the long-term U.S. Treasury bond ETF (Sharpe ratio = 0.83).
For investors, it is important to consider how much risk they are willing to bear during periods of market overheating, in order to decide which hedging asset to invest in.
Important Reminder: This analysis is for reference only and does not constitute any product or investment advice.
We welcome readers interested in various trading strategies to consider purchasing relevant solutions from Quantitative Finance Solution. With our high-quality databases, you can construct a trading strategy that suits your needs.
“Taiwan stock market data, TEJ collect it all.”
The characteristics of the Taiwan stock market differ from those of other European and American markets. Especially in the first quarter of 2024, with the Taiwan Stock Exchange reaching a new high of 20,000 points due to the rise in TSMC’s stock price, global institutional investors are paying more attention to the performance of the Taiwan stock market.
Taiwan Economical Journal (TEJ), a financial database established in Taiwan for over 30 years, serves local financial institutions and academic institutions, and has long-term cooperation with internationally renowned data providers, providing high-quality financial data for five financial markets in Asia.
With TEJ’s assistance, you can access relevant information about major stock markets in Asia, such as securities market, financials data, enterprise operations, board of directors, sustainability data, etc., providing investors with timely and high-quality content. Additionally, TEJ offers advisory services to help solve problems in theoretical practice and financial management!
Enhancing Investment Performance of the Ichimoku Cloud with the XGBoost Machine Learning Algorithm
Michael Sivy’s 4 Key Income Investing Principles Unveiled
