
Table of Contents
Have you ever thought of revenue as a signal? The revenue figures in financial reports are not only a direct reflection of a company’s operational status but also a potential key to predicting stock price fluctuations. This article will use quarterly reports to select stocks, screen for the top 20% of companies listed on the Taiwan Stock Exchange based on their quarterly revenue, and engage in bullish trading strategies. Using this revenue-based backtesting method, we can capture potential strong stocks in the market and validate the effectiveness of this strategy through accurate data. This approach is simple and provides investors with a stable and systematic basis for stock selection, uncovering the hidden patterns behind stock price movements.
This article uses MacOS and VS code as the editor.
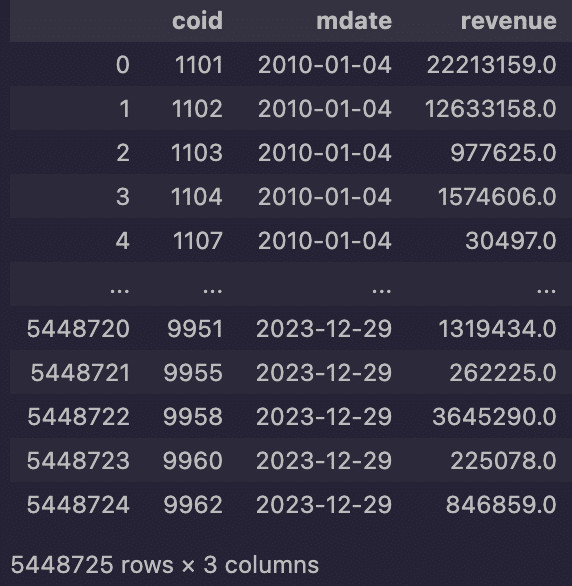
Our quarterly reports strategy is to select all listed stocks in Taiwan. However, since some companies do not disclose quarterly revenue data, we first obtain monthly revenue figures and then process them into quarterly revenue data. As our indicator is quarterly revenue, we can get the data a maximum of four times yearly. To ensure that we have a sufficient sample size to evaluate the feasibility of using quarterly revenue as a stock selection indicator, we have set the backtesting period from 2010 to 2023. This allows us to cover a sufficient period, providing more representative data for quarterly reports analysis.
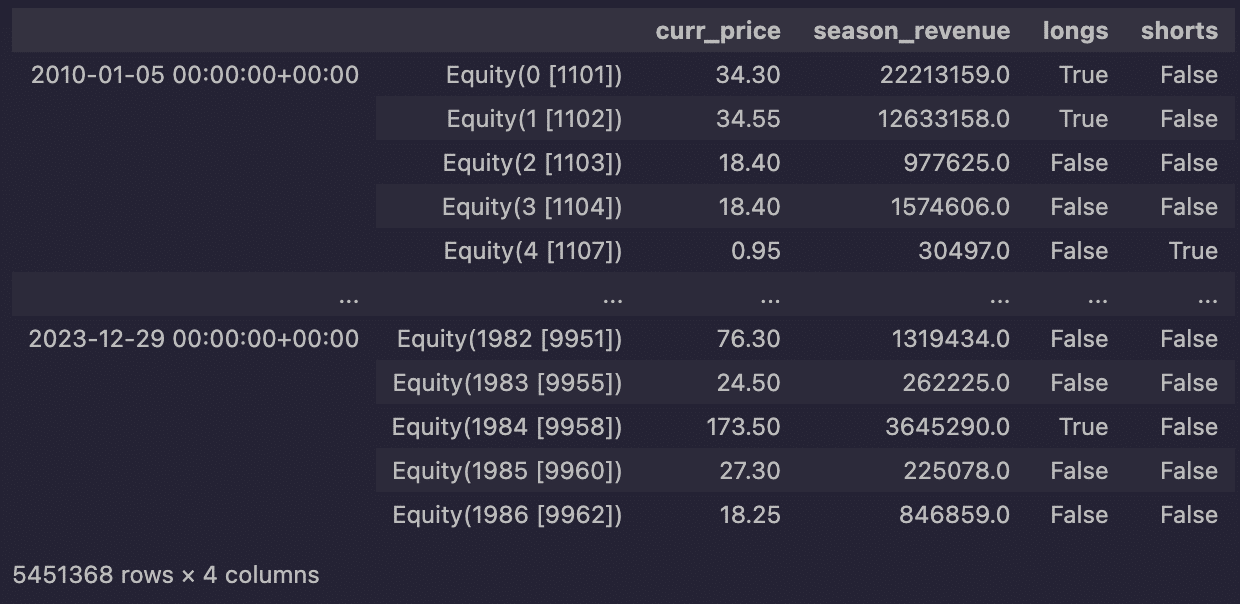
Pipeline() offers users the ability to quickly process quantitative indicators and price-volume data for multiple securities. In this case, we use it to handle the following tasks:
Based on the CPA-certified statements and the company’s self-reported figures, as well as the stock exchange requirements and the varying quarterly report announcement times across different industries, the balance sheet dates are set at the end of March, June, September, and December each year.
TargetPercentPipeAlgo will perform long positions on stocks where the 'longs' column is marked as True, which allows the necessary parameters to be set for backtesting. In this example, we put the following :
from zipline.algo.pipeline_algo import *
algo = TargetPercentPipeAlgo(
                        start_session=start_dt, # Start time of the backtest
                        end_session=end_dt, # End time of the backtest
                        capital_base=1e7, # Initial capital set to 10 million
                        tradeday=tradeday, # Trading day parameter
                        max_leverage=0.9, # Maximum leverage ratio of 0.9
                        pipeline=make_pipeline, # Use the data of pipeline
                        slippage_model=slippage.VolumeShareSlippage(volume_limit=0.15, price_impact=0.01), # Slippage model
                        commission_model = commission.Custom_TW_Commission(min_trade_cost = 20, discount = 1.0, tax = 0.003), # Commission model for the Taiwan market
                        custom_loader=custom_loader, # Custom data loader for loading specific data
)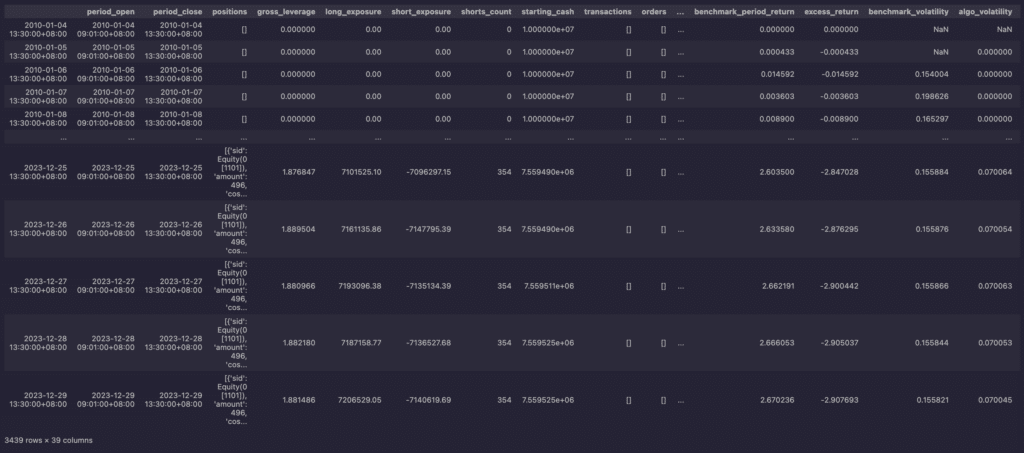
To further understand the performance of this quarterly reports strategy, we compared the cumulative returns of the quarterly reports strategy with the cumulative return of the benchmark index and visualized the results as follows :
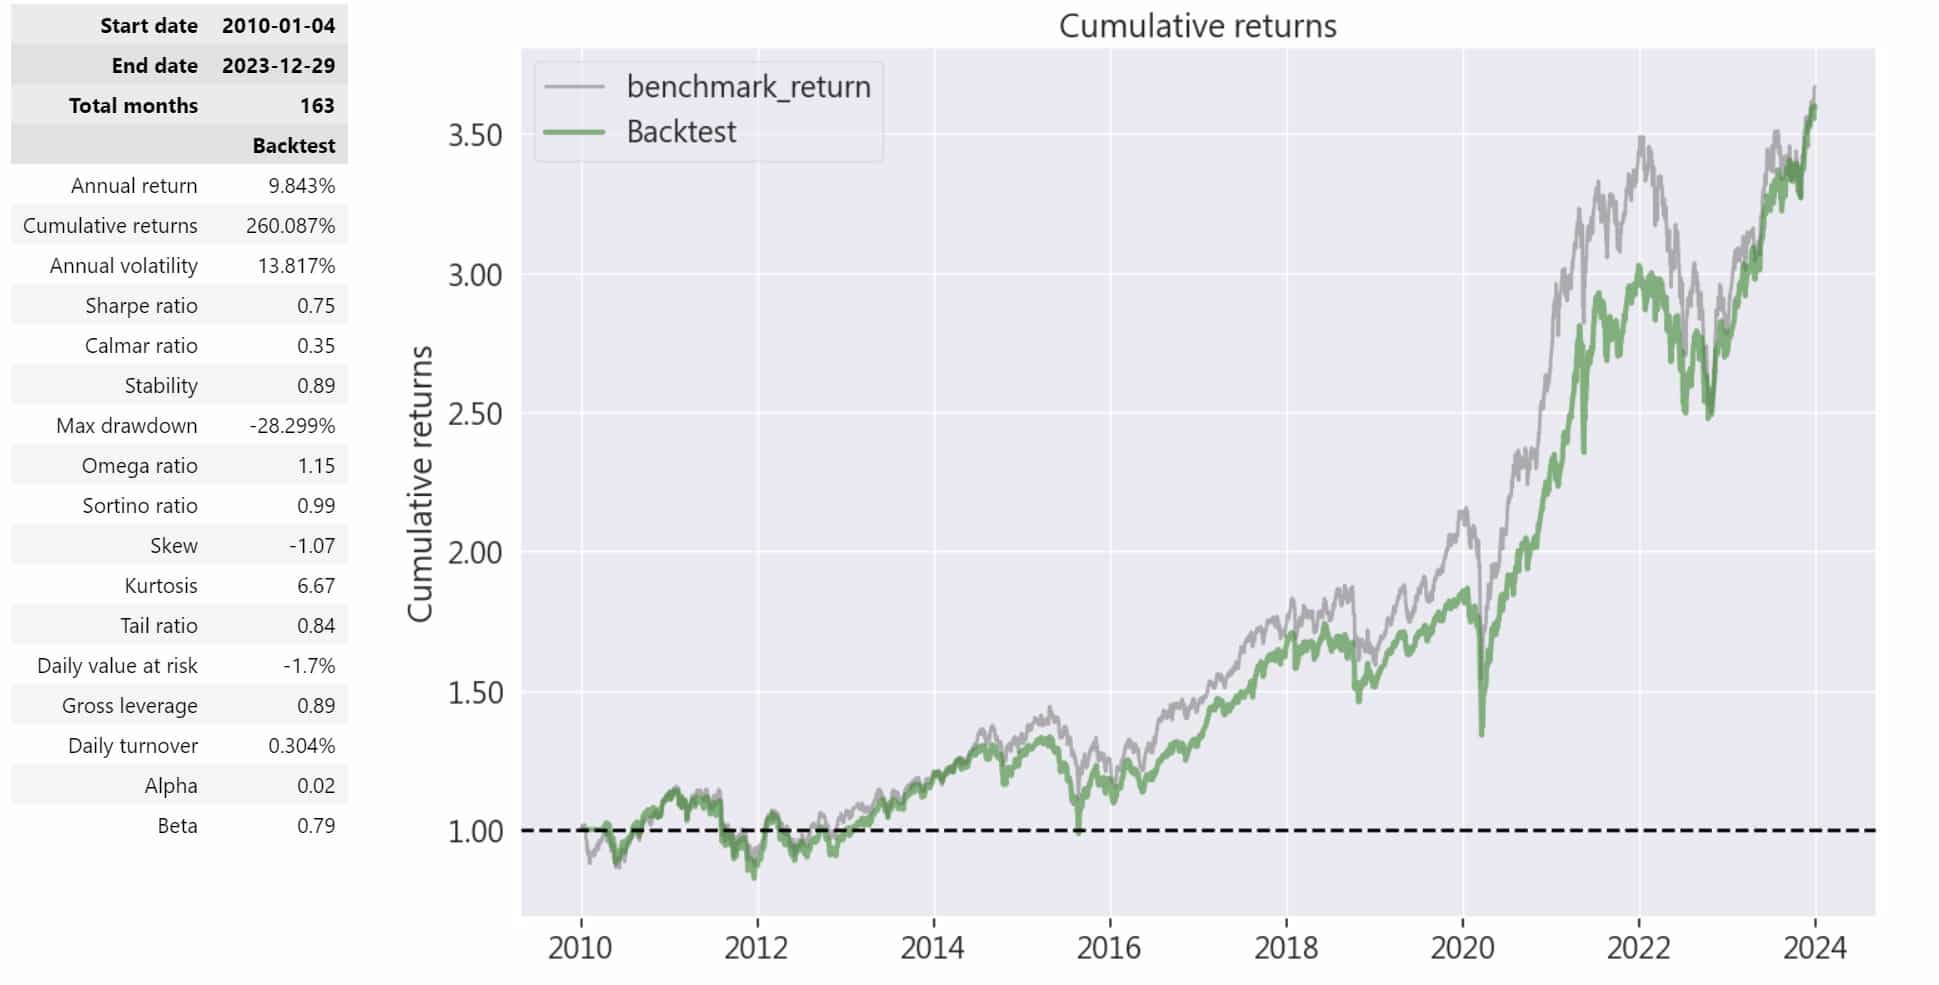
From the data shown above, it can be observed that the cumulative return of the quarterly report stock selection backtest reached 260.087%, while the annualized return was 9.843%. Over a 13-year backtesting period, this performance could be more outstanding. Although the maximum drawdown reached -28.299%, it is acceptable considering the 13-year backtesting period. Additionally, the annualized volatility was 13.817%, indicating that this is a relatively stable strategy.
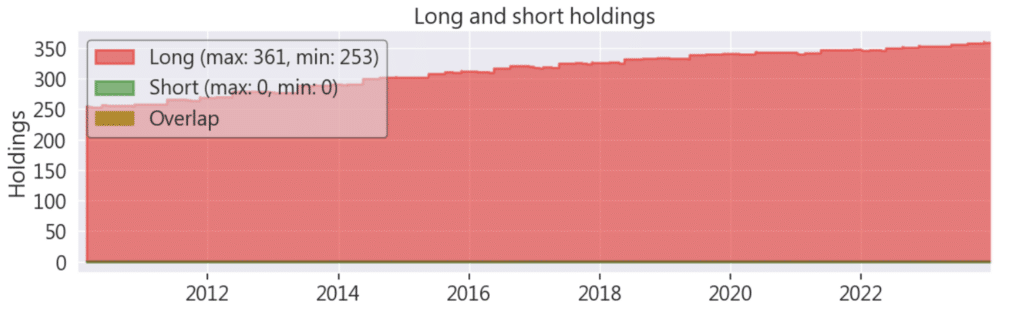
From this chart, since we are selecting the top 20% of all listed stocks in Taiwan each quarter, in practice, it’s unlikely for an individual to manage that many stocks. The author suggests that for actual operations, it would be better to filter the stock pool further using other fundamental data, such as PE or BE ratios, narrowing it down to around ten stocks, which should be sufficient.
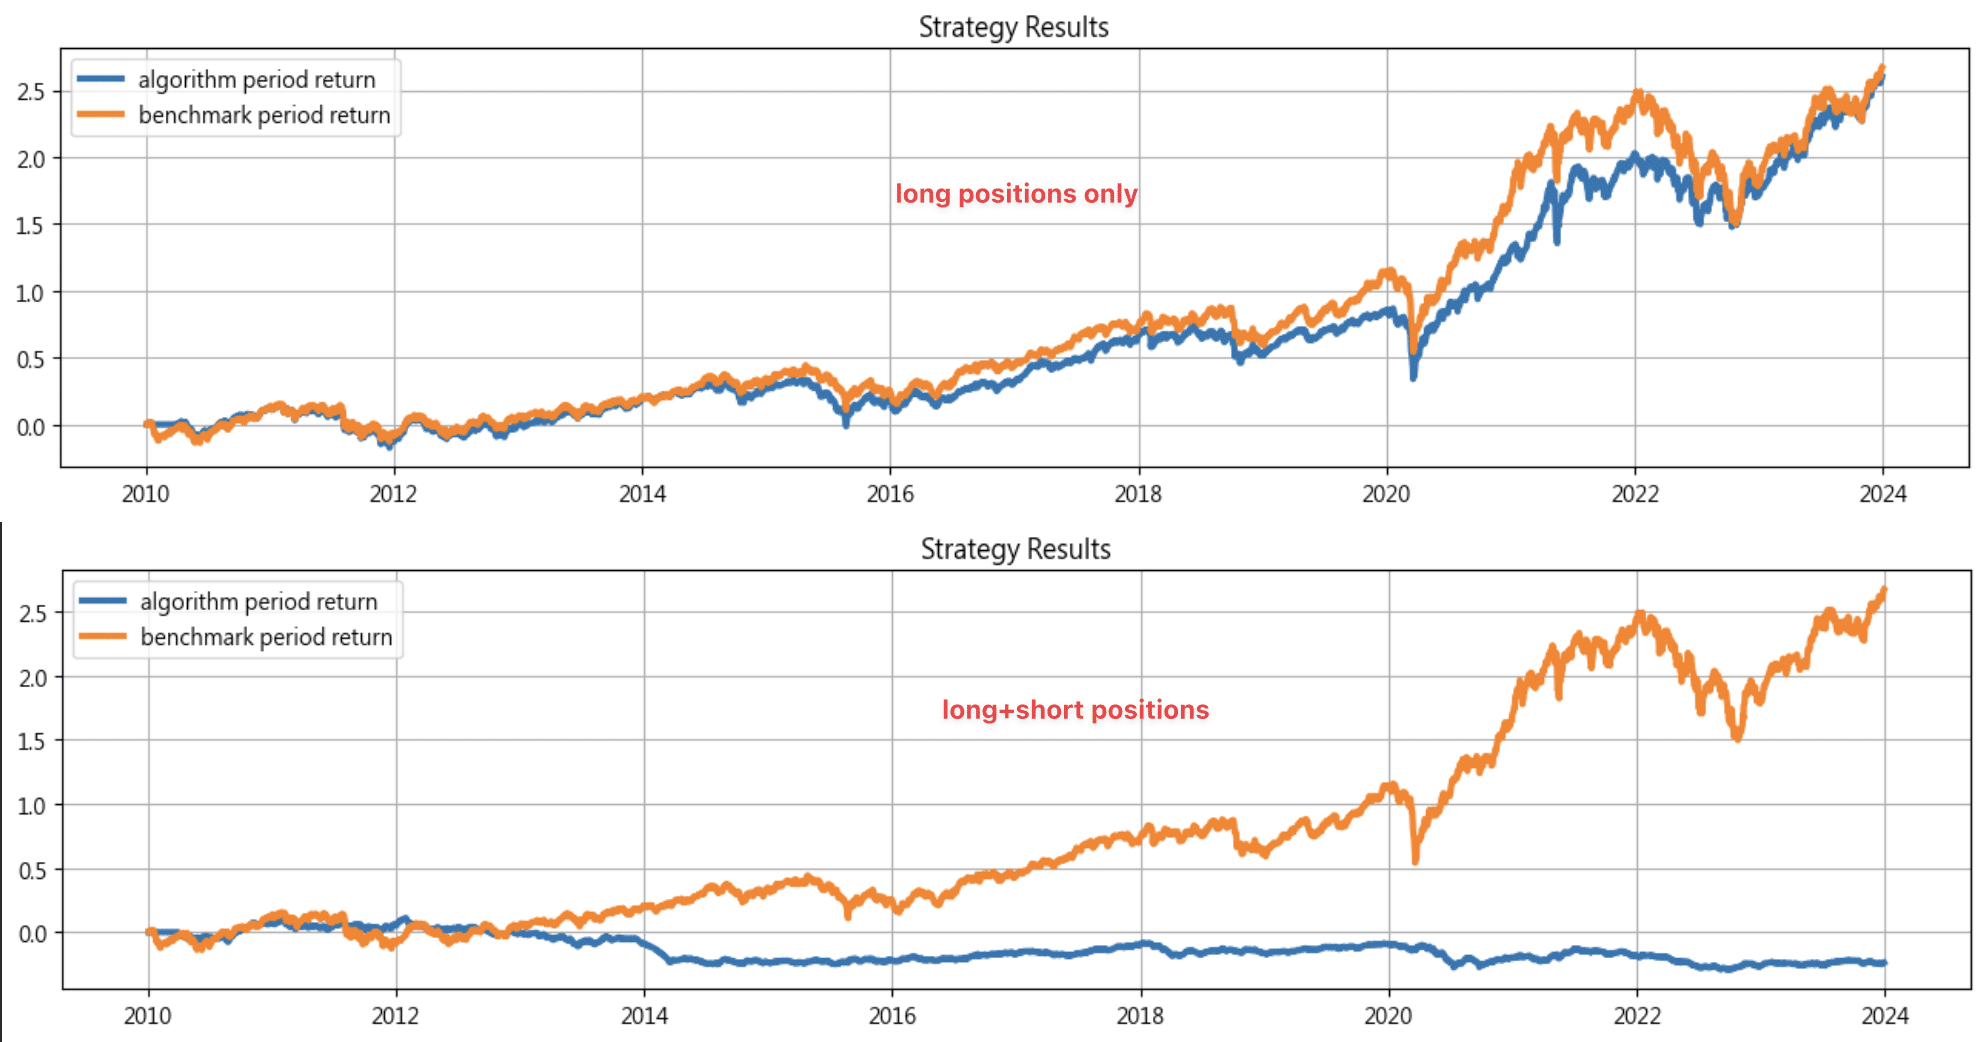
The chart shows that the long-only strategy based on quarterly report stock selection significantly outperformed the long-short strategy in the long-term backtest. The former achieved steady growth in a bullish market, generating excess returns. At the same time, the latter had some short-term advantages in volatile markets but failed to outperform the benchmark over the long term. The author speculates that this may be due to the underperformance of short positions when the overall market was experiencing strong growth, leading to the long-short strategy’s relatively weaker performance compared to the market in recent years.
This quarterly report stock selection strategy is a special backtest because it relies on quarterly revenue information, which requires a relatively long time to show significant results. In a weak bear market, a long-short strategy can achieve higher profits; however, in a strong bull market, the long-only strategy has an advantage, delivering more stable returns. Nevertheless, as seen from the alpha value, there won’t be much excess return. Although it continues to rise amidst market volatility, showing a steady upward trend with lower risk, it is a strategy that requires a longer time to yield results.
Please note that the strategy and target discussed in this article are for reference only and do not constitute any recommendation for specific commodities or investments. In the future, we will also introduce using the TEJ database to construct various indicators and backtest their performance. Therefore, we welcome readers interested in various trading strategies to consider purchasing relevant solutions from TQuant Lab. You can construct a trading strategy that suits your needs with our high-quality databases.
“Taiwan stock market data, TEJ collect it all.”
The characteristics of the Taiwan stock market differ from those of other European and American markets, and the dynamics of retail investors are worth noting. Especially in the first quarter of 2024, with the Taiwan Stock Exchange reaching a new high of 20,000 points due to the rise in TSMC’s stock price, global institutional investors are paying more attention to the performance of the Taiwan stock market.
Taiwan Economical Journal (TEJ), a financial database established in Taiwan for over 30 years, serves local financial institutions and academic institutions, and has long-term cooperation with internationally renowned data providers, providing high-quality financial data for five financial markets in Asia.
With TEJ’s assistance, you can access relevant information about major stock markets in Asia, such as securities market, financials data, enterprise operations, board of directors, sustainability data, etc., providing investors with timely and high-quality content. Additionally, TEJ offers advisory services to help solve problems in theoretical practice and financial management!
