
Table of Contents
In financial investment, mastering accurate and comprehensive data is an indispensable skill, and effectively managing stock pools and acquiring stock price data is the key to unlocking this skill. With the tools and APIs provided by TQuant Lab, we can easily define screening criteria, quickly establish stock pools that meet specific requirements, and retrieve relevant historical stock price data.
This article will guide you step by step through setting up the environment and configuring your API Key, as well as explain how to use the get_universe function to obtain stock samples based on specific conditions. Whether you are a beginner in investing or a data analysis enthusiast, this guide will help you master the automation of data retrieval, laying a solid foundation for future quantitative analysis. Through examples and hands-on operations, you can quickly get started and apply these techniques to your investment strategies.
A stock pool is like a shopping list in our daily lives. Imagine grocery shopping in a supermarket with thousands of products on the shelves. If you don’t filter your choices, you may spend a long time selecting items or buying things you don’t need. However, if you prepare a shopping list in advance, such as “breakfast ingredients” or “fitness diet,” you can quickly locate the relevant items in the store, saving time and improving efficiency.
Similarly, a stock pool aims to help investors filter out stocks that meet specific criteria from the vast stock market. For instance, you might set a condition like:
“I want to find common stocks of semiconductor companies listed in Taiwan.”
With a stock pool, you get a curated list of stocks that meet this condition, just like a shopping list helps you focus on relevant grocery items. This allows you to concentrate on analyzing only the relevant stocks without wasting time on unrelated companies.
In short, a stock pool acts as a “compass” in your investment journey, helping you navigate the complex market and providing a reliable foundation for decision-making.
With thousands of stocks in the market, it is easy to get lost in a sea of data if you lack clear selection criteria. A well-defined stock pool lets you focus on relevant stocks quickly, saving time.
By setting specific selection criteria, a stock pool ensures that you consider both successful and failed companies, rather than only analyzing those that have survived. This helps create a more comprehensive view when backtesting investment strategies.
Stock pools can be integrated with quantitative strategies, aiding in backtesting and data analysis. This ensures that your investment targets are based on a filtered and reliable dataset, improving the accuracy and effectiveness of your analysis.
In quantitative analysis and investment strategy design, quickly and accurately retrieving stock pool data is critical. With the tools provided by TQuant Lab, we can conveniently use the get_universe function to create custom stock pools based on different screening criteria, laying the groundwork for subsequent analysis.
The get_universe function is primarily used to screen and return a list of stock symbols that meet specific conditions. It allows users to filter stocks within a particular time range based on criteria such as market type, industry, and security type. The resulting stock list can seamlessly integrate with quantitative strategies and backtesting tools.
✅ Stock Pool Creation – Automatically filters stocks that meet the specified criteria, eliminating the need for manual selection.
✅ Conditional Filtering – Supports various screening conditions such as market type, sector, industry, index inclusion, etc.
✅ Dynamic Range Selection – Returns stocks that meet the criteria within a specified date range.
get_universe(start,
end = datetime.datetime.now().date().strftime(%Y-%m-%d),
trading_calender = get_calender('TEJ_XTAI'),
**kwargs)
Leveraging the get_universe function can significantly enhance your stock screening process, ensuring your investment analysis is based on structured and high-quality data.
The following parameters are responsible for setting the time range and trading calendar when filtering the stock pool:
The function will return all available stocks if no filtering criteria are specified.
These parameters determine the content of the returned stock pool, including:
These criteria can be customized flexibly based on your specific needs. For more details, please refer to the relevant documentation link.
We will walk through nine examples to help you better understand how to utilize the get_universe function.
First, we need to import the necessary libraries and set up the API configuration:
import pandas as pd
import datetime
import tejapi
import os
import numpy as np

# Set TEJ API Key and Base URL
os.environ['TEJAPI_KEY'] = "your key"
os.environ['TEJAPI_BASE'] = "https://api.tej.com.tw"

# Define Start and End Dates for Screening
start = '2024-01-01'
end = '2025-01-01'

# Import get_universe function
from zipline.sources.TEJ_Api_Data import get_universe
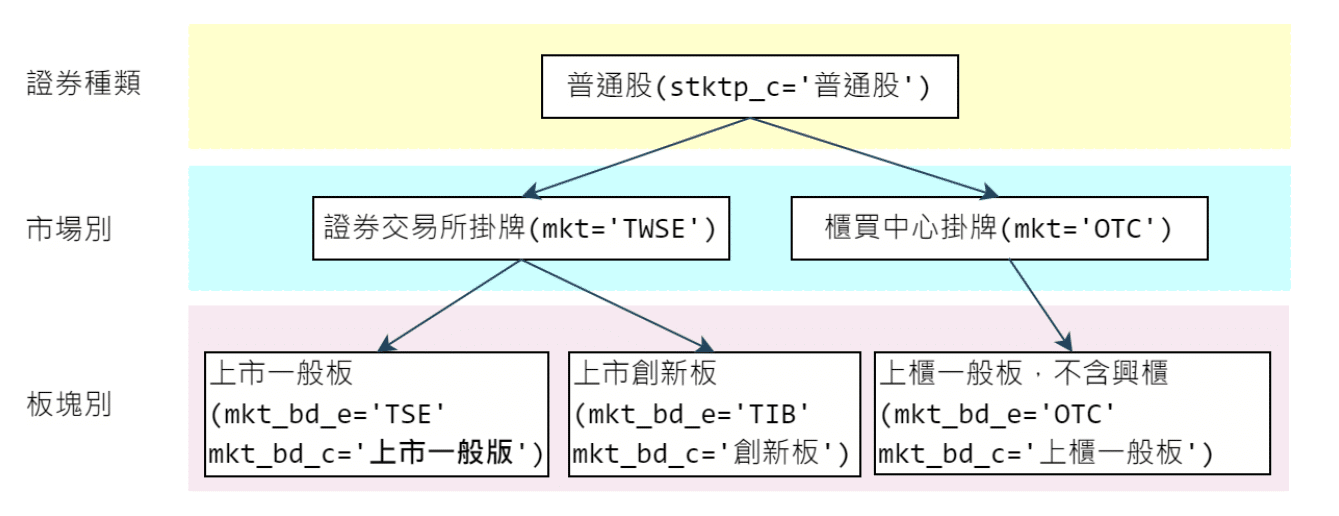
get_universe(start, end, mkt_bd_e=['TSE', 'OTC'])get_universe(start, end, mkt=['OTC'])get_universe(start, end, mkt=['TWSE', 'OTC'], stktp_c=['普通股'])
get_universe(start, end, sub_ind_c=['M2324 半導體業'])get_universe(start, end, sub_ind_e=['M2324 Semiconductor',
'M2325 Computer and Peripheral Equipment'])get_universe(start, end, stktp_c=['ETF', '普通股'], mkt=['TWSE'])get_universe(start, end, idx_id='IX0002')get_universe(start, end, main_ind_c='M1100 水泥工業', idx_id='IX0006')get_universe(start, end, main_ind_c=['一般產業'], stktp_c='普通股')We now have a filtered target list after successfully creating a stock pool that meets our criteria. However, the stock pool is the starting point for investment data analysis. We need additional detailed financial data to perform in-depth analysis or strategy development.
This is where TejToolAPI comes into play. With TejToolAPI, we can efficiently retrieve historical stock-related data, including financial information such as:
✅ Earnings per Share (EPS)
✅ Growth Rate
✅ Dividends
✅ Other key financial indicators
By integrating TejToolAPI, we enhance the analytical value of every stock in our stock pool.
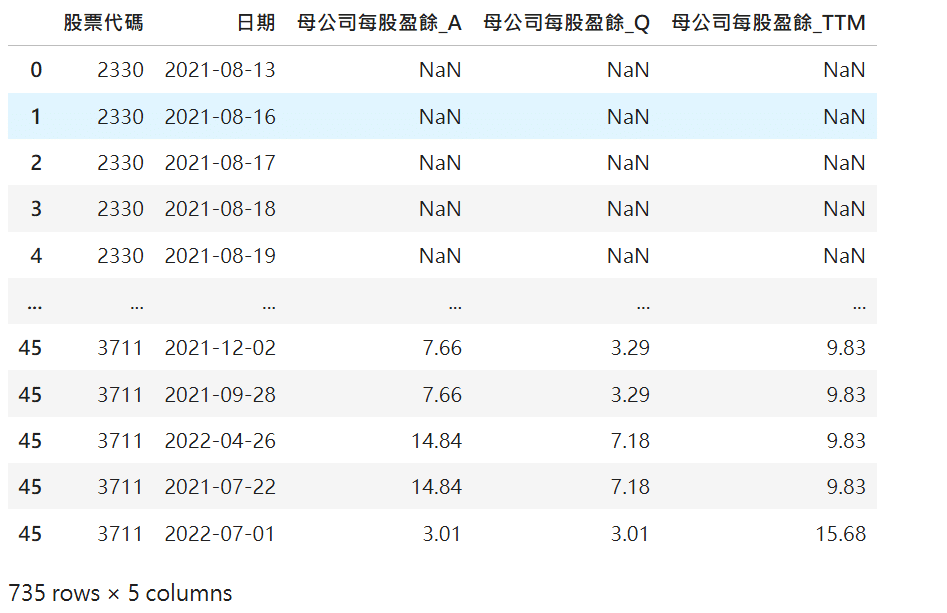
The get_history_data function allows users to retrieve historical data related to securities and transactions. Below are its key parameters:
ticker = ["2330", "1101", "3711"]  # Define Stock Codes
columns = ["eps"]  # Specify Data Fields

TejToolAPI.get_history_data(
    ticker = ticker,
    columns = columns,
    transfer_to_chinese = True,  # Convert column names to Chinese
    start = pd.Timestamp("2021-07-02"),  # Set Start Date
    end = pd.Timestamp("2022-07-02"),  # Set End Date
    fin_type = ["A", "F", "TTM"],  # Retrieve multiple financial data types
    include_self_acc = "Y"  # Include self-reported data
)
By combining get_universe for stock screening and TejToolAPI.get_history_data for retrieving financial metrics, we can automate the stock selection and data collection process. This enables efficient quantitative analysis and enhances investment decision-making.
Unlocking the Power of Data with TejToolAPI
With TejToolAPI, we can effortlessly and efficiently extract rich datasets from the TEJ database, including:
✅ Financial indicators
✅ Growth rates
✅ Various multi-dimensional data
These datasets deepen our understanding of each stock in the stock pool and serve as a critical foundation for investment analysis and strategy design.
Important Reminder: This analysis is for reference only and does not constitute any product or investment advice.
We welcome readers interested in various trading strategies to consider purchasing relevant solutions from Quantitative Finance Solution. With our high-quality databases, you can construct a trading strategy that suits your needs.
“Taiwan stock market data, TEJ collect it all.”
The characteristics of the Taiwan stock market differ from those of other European and American markets. Especially in the first quarter of 2024, with the Taiwan Stock Exchange reaching a new high of 20,000 points due to the rise in TSMC’s stock price, global institutional investors are paying more attention to the performance of the Taiwan stock market.
Taiwan Economical Journal (TEJ), a financial database established in Taiwan for over 30 years, serves local financial institutions and academic institutions, and has long-term cooperation with internationally renowned data providers, providing high-quality financial data for five financial markets in Asia.
With TEJ’s assistance, you can access relevant information about major stock markets in Asia, such as securities market, financials data, enterprise operations, board of directors, sustainability data, etc., providing investors with timely and high-quality content. Additionally, TEJ offers advisory services to help solve problems in theoretical practice and financial management!
🔹 Flexible parameter settings – Customize data queries to suit different investment needs.
🔹 Comprehensive field selection – Extract precise financial and market data for analysis.
🔹 Seamless integration – Quickly integrate retrieved data into the quantitative analysis process.
Now that you have a basic understanding of retrieving the data you need using TejToolAPI, you can start incorporating these datasets into your investment workflow.
For more advanced insights, check out the links below, where we provide deeper explanations and case studies on using TejToolAPI to refine your investment strategies.
“Welcome, investors, to refer to this. We will continue to introduce how to use the TEJ database to construct various indicators and backtest their performance. Therefore, we invite readers who are interested in trading backtests to explore TQuant Lab‘s related plans, which allow you to build trading strategies that suit you using high-quality databases.
A friendly reminder: This analysis is for reference only and does not constitute any advice on products or investments.”
