Table of Contents
In the process of implementing responsible investment and responsible lending, financial institutions consider whether the investment and financing targets are involved in significant ESG controversies, both during the assessment and approval before investment/financing and the monitoring and management after investment/financing. However, these ESG events originate from various sources and occur at different times, making data collection challenging. Moreover, identifying these events among numerous targets and events requires significant manpower and time resources.
To address the challenges of collecting ESG events and assessing their impact on companies, the TESG Event Radar provides users with quantified daily ESG event scores and offers individual event content and intensity analysis. This makes daily corporate ESG monitoring less challenging.
The “TESG Event Radar” comprises the ESG Event Database and ERS (Event Radar Score) for events.
The ESG Event Database includes ESG news and events of Taiwanese companies. It analyzes the impact category (E, S, or G) of each event on the company and assesses the influence of the event on the company’s ESG performance, assigning an intensity score.
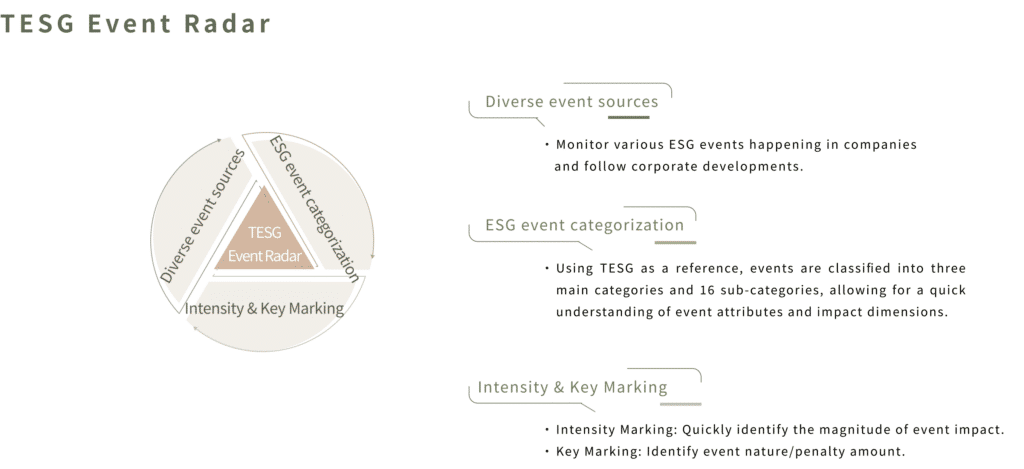
The following explains the composition of the ESG Event Database structure: event classification, rules and methods for event intensity scoring, and specific attribute marking of events.
the “Intensity” represents TEJ’s summarized scoring rules for different event contents within each event category. Each news event is given an intensity score ranging from 0 to -5. The lower the score, the more severe the event. For example, in the E dimension (Environmental), for an environmental event, if the event results in a fine of over 10 million NTD or leads to the removal or suspension of the Chairman or responsible person, it is assigned an intensity score of -4. In the S dimension (Social), for an industrial accident event, if the accident results in serious injuries to personnel, it is given an intensity score of -3. If it results in fatalities, it receives an intensity score of -4 or -5.
In addition to the intensity scoring mentioned above, TEJ also determines whether an event is an extension of past events that occurred within the last six months. For example, if Taiwan Cement Corporation experienced a workplace safety event on 4/1, and subsequently, other legal events or penalty announcements are related to this initial event, TEJ marks the time of the initial event to help users track related information on the same event.
Moreover, significant issues in ESG events, such as fair trade or anti-monopoly actions, outsourcing, fatalities, penalty amounts, executive sanctions, and convictions, are specially marked in the ESG event data. These markers assist in filtering and determining the severity of events for reference purposes.
To avoid duplicate calculations of identical or similar events during scoring, each event is marked after it occurs. If the same event happens within the next six months, it will be annotated, and the initial date of the event will be provided to facilitate a comprehensive understanding of the event’s occurrence.
Regarding the mentioned events, TEJ specifies the penalty amount imposed by each regulatory authority and marks it as 9,000,000 NTD in the penalty amount field for users to understand the severity of the enforcement action.
In general, penalties imposed on corporate executives and employees are administrative fines determined by regulatory authorities and do not involve criminal convictions. On the other hand, criminal convictions are governed by criminal law and are considered more severe compared to administrative penalties.
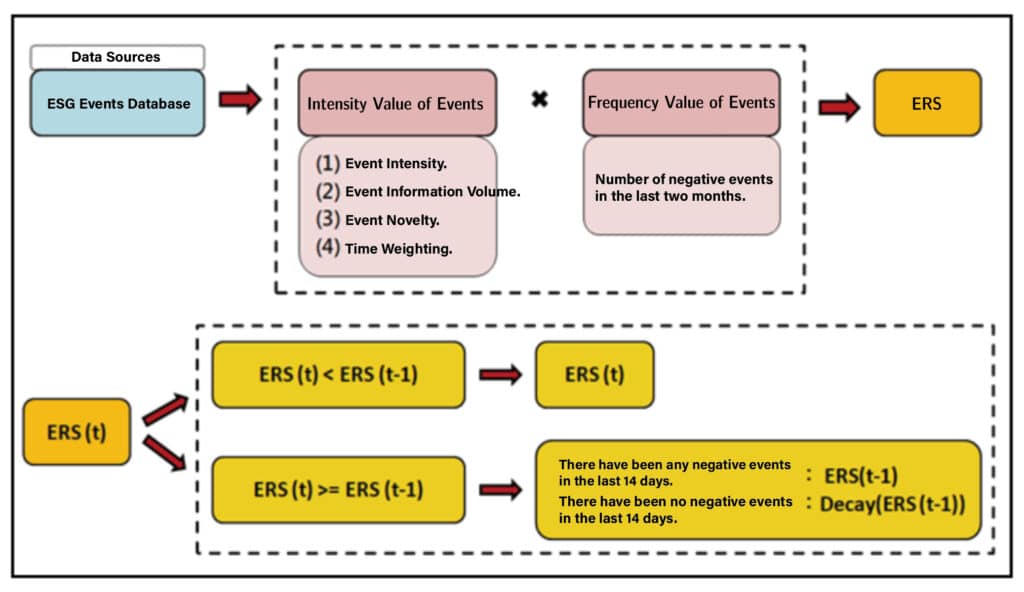
TEJ has developed a quantitative model based on the “TESG Event Radar – ESG Event Database” to transform discrete event data into continuous scores. The model primarily considers variables such as event intensity, event novelty, event occurrence frequency, and time to derive the daily “Event Radar Score (ERS).” Users can use the ERS score to quickly assess the level of ESG event risk associated with a company, compare it with peers, or track ESG event risk trends over a specific period.
The daily ERS score is calculated using two main metrics: the intensity value of events and the frequency value of events. The event intensity score calculation takes into account event intensity, event information volume, event novelty, and time weighting. On the other hand, the event frequency score is based on the number of negative events that occurred within the past two months. The overall scoring framework is illustrated in the diagram.
The ERS scores range from 0 to -100, reflecting the current level of ESG event risk for a company. The interpretation of ERS scores is as follows:
| Score intervals | ESG event risk level |
|---|---|
| 0~-25 | Low risk |
| -25~-50 | Moderate risk |
| -50~-100 | High risk |
Additionally, you can also observe the “Highest ERS Score in the Past Two Years” and “ERS Score Change in the Past One Month” to gain a better understanding of the company’s status. The “Highest ERS Score in the Past Two Years” reflects the company’s ESG event risk level in the past two years. If it is less than -50, it indicates that the company has been in a high-risk state in the past two years and requires special attention. The “ERS Score Change in the Past One Month” reflects whether the company has experienced significant ESG risk events in the past month. If the change is less than -25, it requires special attention.
“ESG Event Database” enhances monitoring during the TESG rating update blackout period and addresses the issue of not considering event severity. When users observe various ESG events, they can quickly understand the severity of each event through the intensity score. The event categorization and auxiliary fields help users find relevant event details efficiently and serve as a basis for judging the event’s intensity.
“Event Radar Score (ERS)” quantifies the originally unstructured ESG events and intensities. By analyzing changes in ERS scores, users can quickly identify companies that require monitoring and attention from numerous companies. Additionally, through the comprehensive information provided by the “ESG Event Database,” users can gain in-depth insights into event details, facilitating faster decision-making processes for responsible investment and responsible credit evaluation.
