
Table of Contents
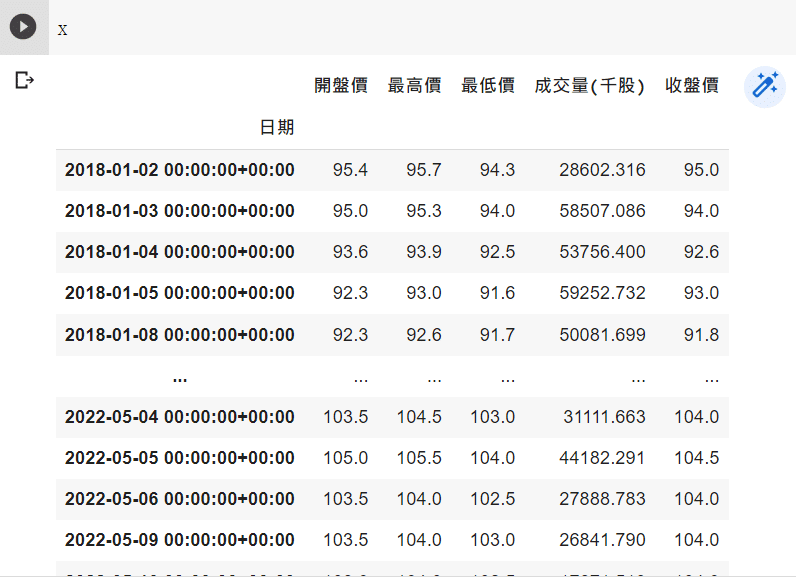
預測股票一直是人們所追求的,然而股票的隨機性遠遠難以掌握,在資料科學的進步下,計算成本大幅降低,本文用使用相較於【量化分析】預測市場?! 更複雜的深度學習模型,進行股票預測,使用前10天的開盤價、最高價、最低價、收盤價、成交量,預測隔天的收盤價。
本文使用 Google colab作為編輯器
###三寶
import numpy as np
import pandas as pd
import matplotlib.pyplot as plt
import tejapi
tejapi.ApiConfig.api_key=###yourkey
##################
import tensorflow as tf
from keras.layers.core import Dense, Dropout, Activation
from keras.callbacks import EarlyStopping,ModelCheckpoint
from keras.models import Sequential
from keras.layers import LSTM
from sklearn.preprocessing import MinMaxScaler
證券交易資料表:上市(櫃)未調整股價(日),資料代碼為(TWN/EWPRCD)。
建立RMSE 來評估模型預測能力
以及將資料轉換成符合LSTM輸入的形式型態如下圖所示分別代表為
(batch_size,time_steps,seq_len) : 1163組,5天,5個變數

dataset : 輸入訓練資料
target : 預測資料
start_index : 起始點 通常為0 因為後續自己會分組
end_index : 終點 設0
history_size 輸入長度 本文選10 target_size 預測長度 本文選1
def root_mean_squared_error(y_true, y_pred):
    return np.sqrt(np.mean(np.square(y_pred - y_true)
###計算Rmse
def multivariate_data(dataset, target, start_index, end_index, history_size,
                      target_size, single_step=False):
  data = []
  labels = []

  start_index = start_index + history_size
  if end_index is None:
    end_index = len(dataset) - target_size

  for i in range(start_index, end_index):
    indices = range(i-history_size, i)
    data.append(dataset[indices])

    if single_step:
      labels.append(target[i+target_size])
    else:
      labels.append(target[i:i+target_size])

  return np.array(data), np.array(labels)
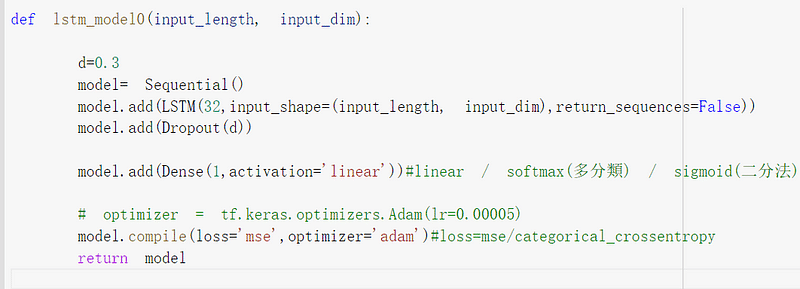
接下來是來疊模型了,其中Dropout是用來防止過擬,本文就不詳盡解釋原理,可以從d去調整從0~1之間,
input length為輸入的時間長度,本文選用10天
input_dim為變數數量,本文總共有5個變數
return_sequences : True 為維持 (batch ,time_steps ,seq_len) ,連接下一層LSTM 設置 False 將會變成一維
loss 使用mean_squared_error訓練,Optimizer 使用 Adam
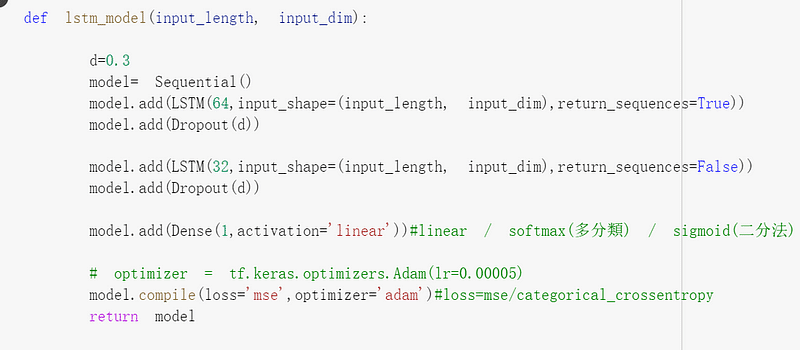
def build_model(input_length, input_dim):
    d=0.3
    model= Sequential()
    model.add(LSTM(128,input_shape=(input_length, input_dim),return_sequences=True))

    model.add(Dropout(d))

    model.add(LSTM(64,input_shape=(input_length, input_dim),return_sequences=False))

    model.add(Dropout(d))

    model.add(Dense(1,activation='linear'))
#linear / softmax(多分類) / sigmoid(二分法)

    model.compile(loss='mse',optimizer='adam')
    return mode1
coid='3037'
start='2016-01-01'
end='2022-5-22'
opts={'columns': ['open_d' ,'high_d','low_d','mdate', 'volume','close_d']}
tw=tejapi.get('TWN/EWPRCD',coid=coid,
                mdate={'gt':start,'lt':end},
                paginate=True,
                chinese_column_name=True,
                opts=opts
                )
tw.set_index("日期",drop=True,inplace=True)
tw.sort_index(inplace=True)
設置 變數 與應變數 收盤價為要預測的,其他為變數
y =tw["收盤價"]
x =tw
scaler=MinMaxScaler(feature_range=(0,1))
y=scaler.fit_transform(y.to_frame())
scaler1=MinMaxScaler(feature_range=(0,1))
x=scaler1.fit_transform(x)
並將資料分成訓練組,驗證組,測試組
x,y=multivariate_data( x ,y , 0 ,None, 10 , 1 ,single_step=True)
split =0.95
x_,y_  = x[0:int(split*len(x))] , y[0:int(split*len(x))]
x_test ,y_test   = x[int(split*len(x)):] , y[int(split*len(x)):]
split= 0.8
x_train,y_train  =x_[:int(split*len(x_))] , y_[:int(split*len(x_))]
x_vaild,y_vaild  =x_[int(split*len(x_)):] , y_[int(split*len(x_)):]


my_callbacks = [
tf.keras.callbacks.EarlyStopping(patience=300, monitor = 'val_loss')
] ######## 在訓練組訓練,使用驗證組選取
filepath="lstm.best.hdf5"
checkpoint = ModelCheckpoint(filepath, monitor='val_loss', verbose=1, mode='min',save_best_only=True)
call_backlist = [my_callbacks,checkpoint]
lstm00 = lstm_model0(10,5)
historylstm0 = lstm0.fit( x_train, y_train, batch_size=30,shuffle=False , epochs=1000,validation_data=(x_vaild,y_vaild),callbacks=call_backlist)
lstm00.summary()
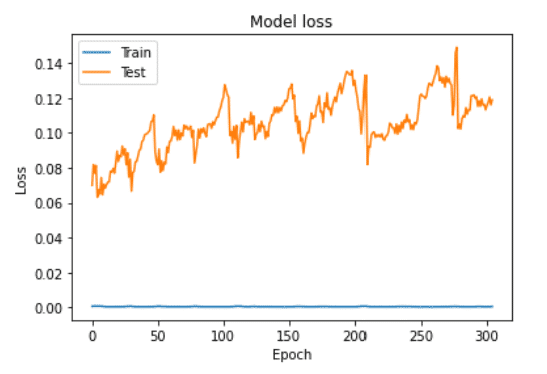
EarlyStopping : 在訓練組訓練參數,以驗證組最低為選擇標準,如果300個epochs,沒有改善即停止訓練
filepath : 模型儲存路徑
ModelCheckpoint : 選擇val_loss最低的當作最後的模型
batch 是每次訓練抽取樣本數
epochs 訓練次數
shuffle True 隨機打亂 False 不打亂排序
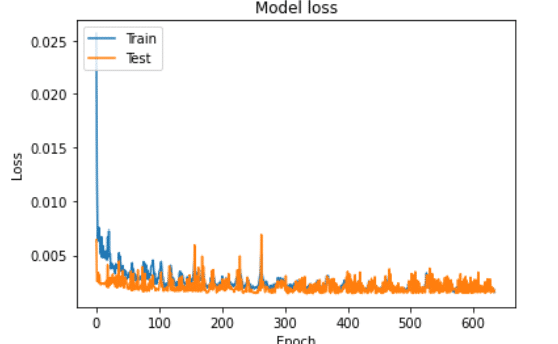
#繪製 訓練情形
plt.plot(historylstm0.history['loss'])
plt.plot(historylstm0.history['val_loss'])
plt.title('Model loss')
plt.ylabel('Loss')
plt.xlabel('Epoch')
plt.legend(['Train', 'Test'], loc='upper left')
plt.show()
lstm0train  = lstm00.predict(x_train)
lstm0val = lstm00.predict(x_vaild)
lstm0pre = lstm00.predict(x_test)
pre = lstm00.predict(x_train)
pre1=lstm00.predict(x_vaild)
fc=np.concatenate((pre,pre1))
yreal=np.concatenate((y_train,y_vaild))
plt.figure(facecolor='white')
pd.Series(fc.reshape(-1)).plot(color='blue', label='Predict1')
pd.Series(yreal.reshape(-1)).plot(color='red', label='Original')
plt.legend()
plt.show()
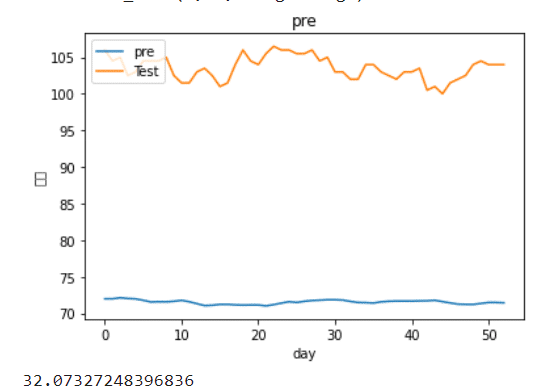
lstm0pre= scaler.inverse_transform(lstm0pre)#將資料轉換回來
y_test = scaler.inverse_transform(y_test.reshape(-1,1))
plt.figure()
plt.plot(lstm0pre)
plt.plot(y_test)
plt.title('pre')
plt.ylabel('股價')
plt.xlabel('day')
plt.legend(['pre', 'Test'], loc='upper left')
plt.show()
root_mean_squared_error(lstm0pre,y_test)
接下來嘗試2層的
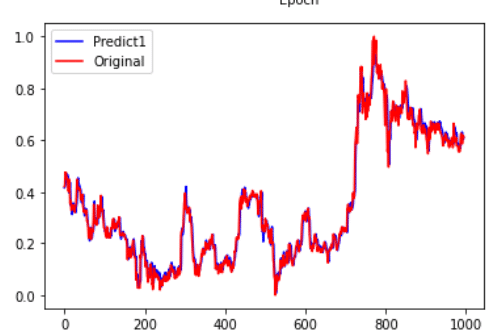
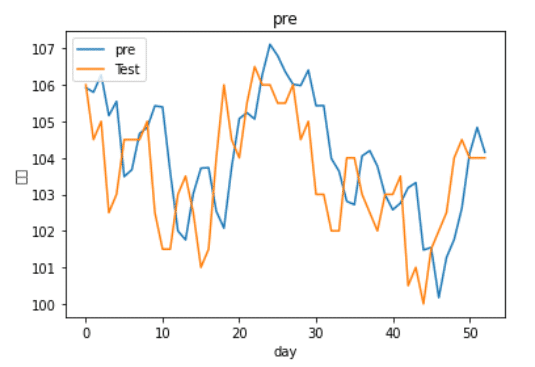
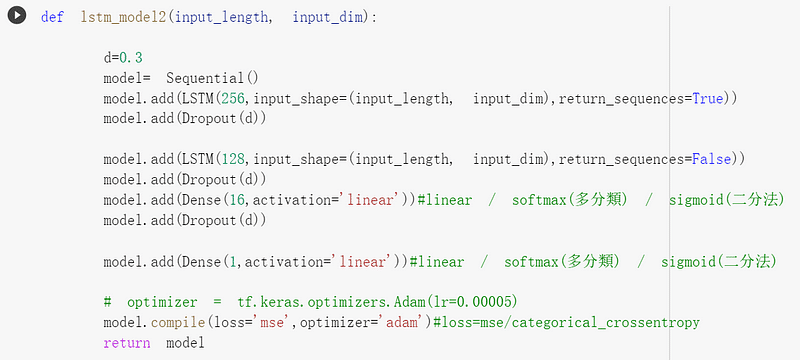
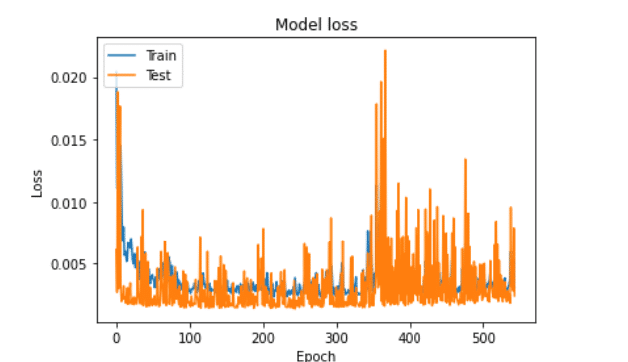
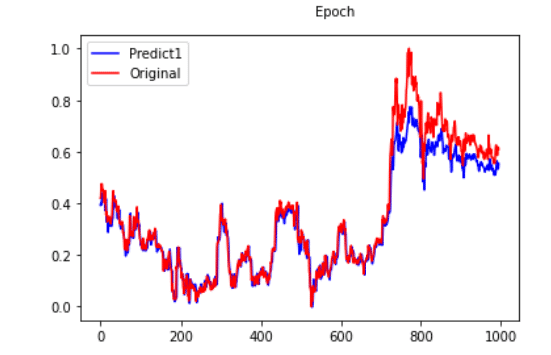
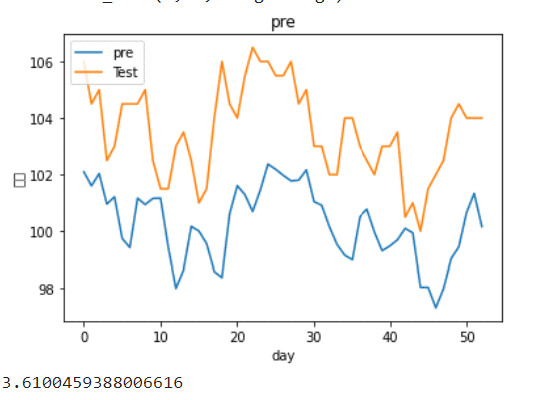
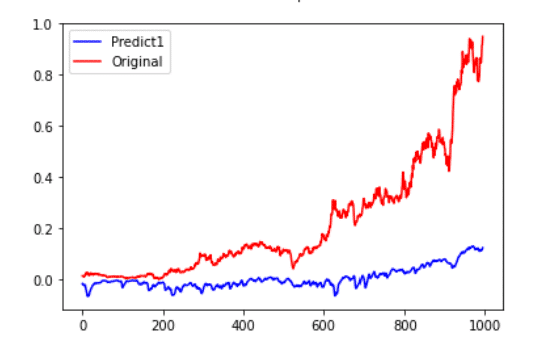
我們能看到雖然在stack-Lstm下擬和效果不錯,但實際觀察過後,發現模型的預測僅僅是把昨天去預測明天,也就是使用深度學習單純預測隔天收盤價也是不太可行的,或許需要改成預測漲跌,以及加入更多特徵看是否能改善預測能力! 也許能結合之前轉寫的一些選股策略再將資料餵入,以後會再為大家介紹!