
Table of Contents
你有曾經想過營收會是一種訊號嗎?財報中的營收數字,不僅是公司營運狀況的直接反映,更是預測股價波動的潛在關鍵。本篇文章將利用季報選股,篩選台股上市櫃公司每季營收的前 20%,並進行多頭操作。透過這種基於營收數據的回測方法,我們可以捕捉市場中潛在的強勢股,並透過實際數據驗證此策略的有效性。這不僅簡單,而且能夠為投資人提供一種穩定且具系統性的選股依據,從中挖掘股價漲跌的玄機。
本文使用 Mac OS 及 VS Code 作為編輯器
我們的策略是選擇台股上市櫃的所有股票。由於我們的指標是每季營收,一年最多只能取得四次資料。為了確保有足夠的樣本數來評估每季營收作為指標的季報選股的可行性,我們將回測期間設定為 2010 年至 2023 年,這樣能夠涵蓋足夠的時間範圍,提供更具代表性的數據進行分析。
# Import package
import os
import pandas as pd
import TejToolAPI
from zipline.sources.TEJ_Api_Data import get_universe

# Input your key
os.environ['TEJAPI_KEY'] = 'your key'
os.environ['TEJAPI_BASE'] = 'https://api.tej.com.tw'

# Get all stock of TWSE & OTC
pool = get_universe(start = '2010-01-01',
                    end = '2023-12-29',
                    mkt = ['TWSE', 'OTC'],
                    stktp_e=['Common Stock-Foreign', 'Common Stock']
                    )

# "ip12" is the column of monthly revenue
columns = ["ip12"]
data = TejToolAPI.get_history_data(
    ticker = pool,
    columns = columns,
    fin_type = 'Q',
    transfer_to_chinese = True,
    start = pd.Timestamp("2010-01-01"),
    end = pd.Timestamp("2023-12-29"),
)

# Set the interval of backtesting
start = '2010-01-01'
end = '2023-12-29'
pool.append('IR0001')
os.environ['mdate'] = start + ' ' + end
os.environ['ticker'] = ' '.join(pool)

# Ingest data to tquant
!zipline ingest -b tquant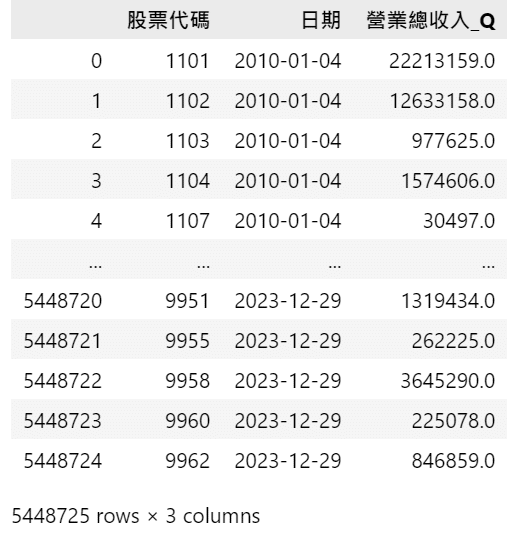
CustomDataset 可以將資料庫中的內容導入 Pipeline 中,方便後續回測使用。於本範例我們用以將上述 transfer 欄位紀錄的每日轉讓資訊導入 Pipeline。擷取部分程式碼如下:
from zipline.pipeline.data.dataset import Column, DataSet
from zipline.pipeline.domain import TW_EQUITIES

class CustomDataset(DataSet):
    # Define a floating point number field to store quarterly revenue
    revenue = Column(float)
domain = TW_EQUITIESPipeline() 提供使用者快速處理多檔標的的量化指標與價量資料的功能,於本次案例我們用以處理:
from zipline.pipeline.filters import StaticAssets

# Importing the StaticAssets filter to create a custom asset mask that excludes a specific benchmark asset.
assets_ex_IR0001 = [i for i in assets if i != bundle.asset_finder.lookup_symbol('IR0001', as_of_date=None)]
benchmark_asset = bundle.asset_finder.lookup_symbol('IR0001',as_of_date = None)

def make_pipeline():

    # Get the season revenue column from the CustomDataset.
    seanson_revenue = CustomDataset.revenue.latest

    # To filter out stocks with revenue in the top and bottom 20% while excluding the specific asset 'IR0001'.
    top_20_decile = seanson_revenue.percentile_between(80, 100, mask=StaticAssets(assets_ex_IR0001))
    bottom_20_decile = seanson_revenue.percentile_between(0, 20, mask=StaticAssets(assets_ex_IR0001))

    # Return value of pipeline column
    my_pipeline = Pipeline(
        columns = {
            'curr_price': TWEquityPricing.close.latest,
            'season_revenue': seanson_revenue,
            'longs': top_20_decile,
            'shorts': bottom_20_decile
        },
        screen = ~StaticAssets([benchmark_asset])
    )
    return my_pipeline

# Redefine the start and end dates for the backtesting period.
start_dt = pd.Timestamp(start, tz = 'UTC')
end_dt = pd.Timestamp(end, tz = 'UTC')
my_pipeline = engine.run_pipeline(make_pipeline(), start_dt, end_dt)
my_pipeline 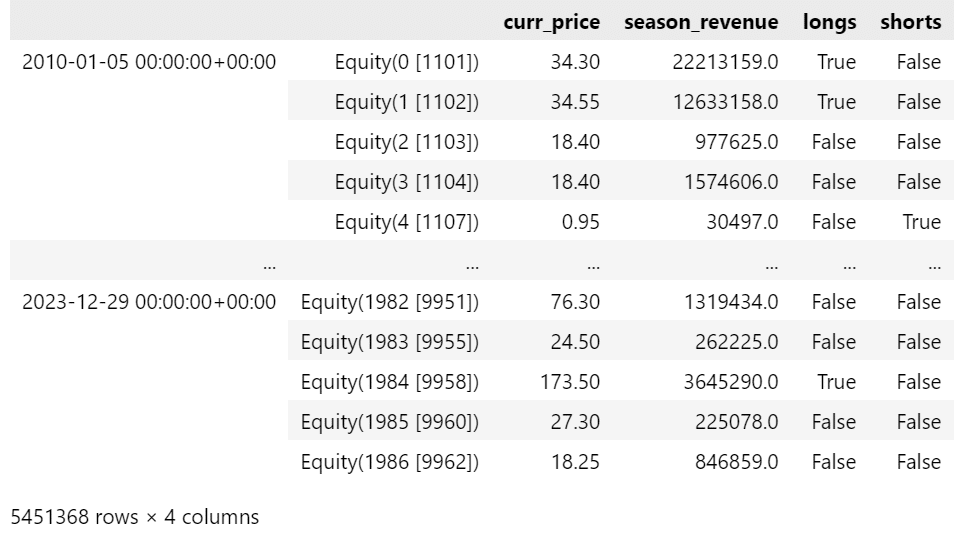
根據會計師簽證跟公司自結數的報告,以及交易所規定,加上各產業季報公告時間不同,所以把平衡日設置為每年的 3, 6, 9, 12月底。
from zipline.utils.calendar_utils import get_calendar

# Convert the dates into a DataFrame and calculate the difference between each date and the midpoint of the season.
cal = pd.DataFrame(cal).rename(columns={0: 'date'})

def get_quarter_end(x):
    month = (x.month - 1) // 3 * 3 + 3  # 將月份設置為 3、6、9、12
    return pd.Timestamp(year=x.year, month=month, day=1, tz='UTC') + pd.offsets.MonthEnd(0)

cal['date'] = cal['date'].apply(get_quarter_end)

# Change the grouping to be based on year and quarter.
tradeday = cal.groupby([cal['date'].dt.year, cal['date'].dt.quarter]).apply(lambda x: x.head(1)).date.tolist()

# Convert the trading days to string format.
tradeday = [str(i.date()) for i in tradeday]

tradeday[:12]TargetPercentPipeAlgo 會根據 longs 欄位為 True 的股票進行多頭操作,並且可以設定相關回測需要的參數,與此例中我們設置:
from zipline.algo.pipeline_algo import *

# Setting the start and end dates for the backtest
start_dt = pd.Timestamp(start, tz = 'UTC')
end_dt = pd.Timestamp(end, tz = 'UTC')

# Creating the Target Percent Pipeline Algorithm
algo = TargetPercentPipeAlgo(
                        start_session=start_dt, # Start time of the backtest
                        end_session=end_dt, # End time of the backtest
                        capital_base=1e7, # Initial capital set to 10 million
                        tradeday=tradeday, # Trading day parameter
                        max_leverage=0.9, # Maximum leverage ratio of 0.9
                        pipeline=make_pipeline, # Use the data of pipeline
                        slippage_model=slippage.VolumeShareSlippage(volume_limit=0.15, price_impact=0.01), # Slippage model
                        commission_model = commission.Custom_TW_Commission(min_trade_cost = 20, discount = 1.0, tax = 0.003), # Commission model for the Taiwan market
                        custom_loader=custom_loader, # Custom data loader for loading specific data
)

# Run backtesting
results = algo.run()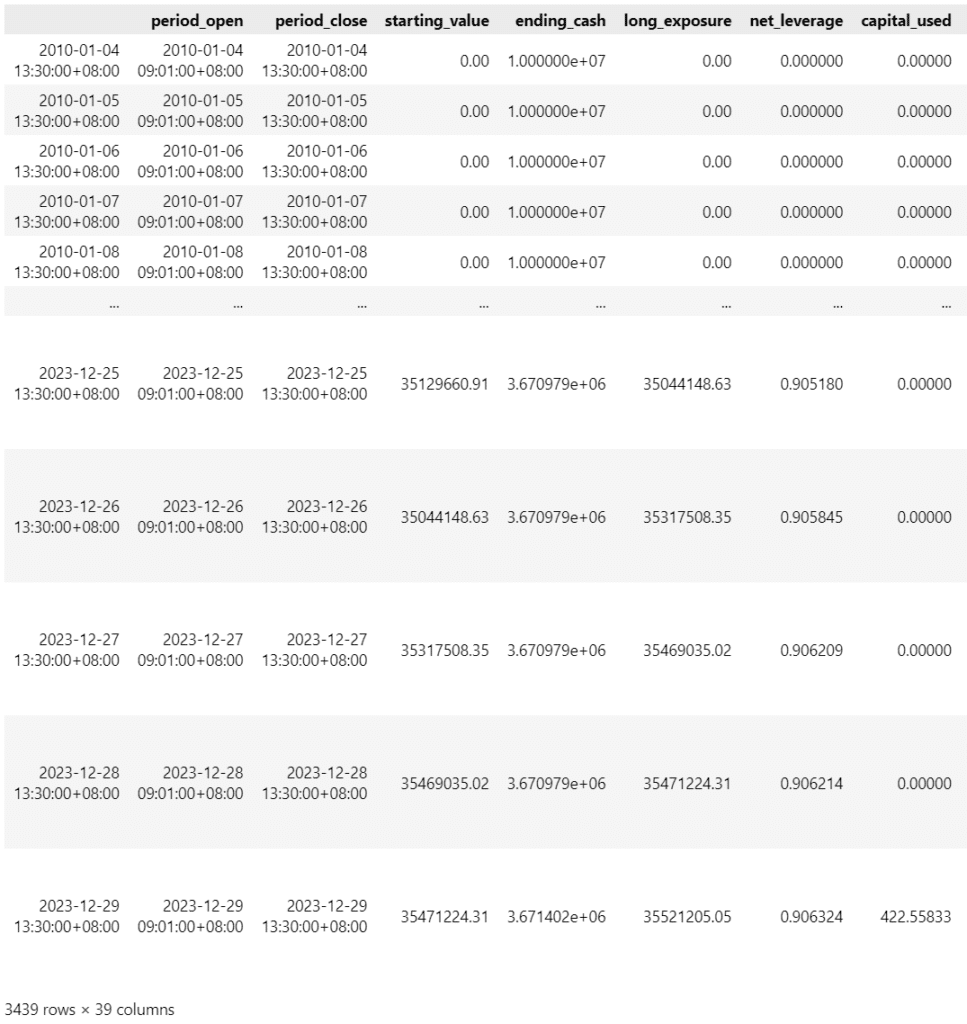
# Extract from the backtest results of Zipline and generate a comprehensive analysis of the portfolio.
returns, positions, transactions = pf.utils.extract_rets_pos_txn_from_zipline(results)
benchmark_rets = results['benchmark_return']

pf.tears.create_full_tear_sheet(returns=returns,
                                positions=positions,
                                transactions=transactions,
                                benchmark_rets=benchmark_rets
                                )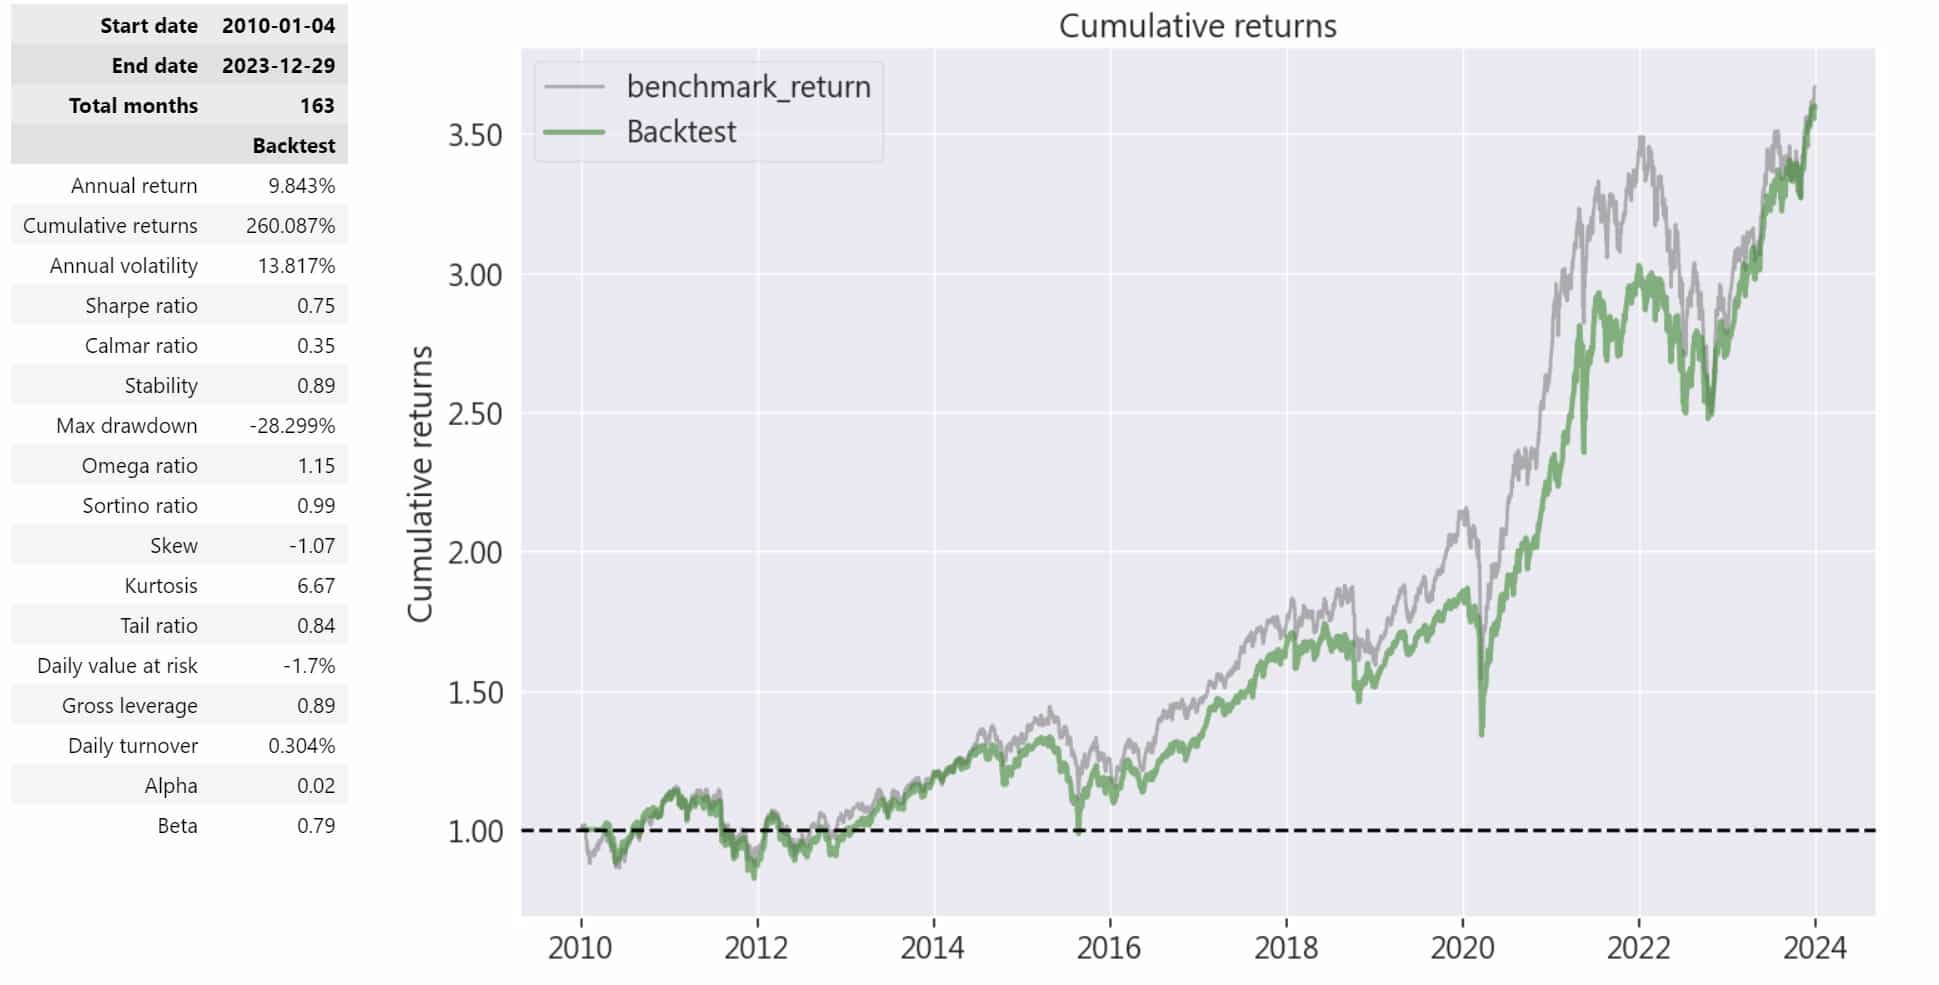
從上圖數據中可以看出,季報選股回測的累積報酬率達到 260.087%,而年化回報率為 9.843%,以 13 年回測期間來看的話並不是特別突出。儘管最大回撤達到了 -28.299%,但以 13 年回測期間來看的話是可以接受的,且年化波動率為 13.817%,顯示此為相對穩定的策略。

那從這個圖可以看到因為我們是取台股上市櫃每季的前 20%,但實際上一個人不會操作那麼多支股票,筆者這邊建議若要實際操作,可以使用其他基本面資料例如 PE、BE 再篩選一次股票池,大約 10 支股票就差不多了。
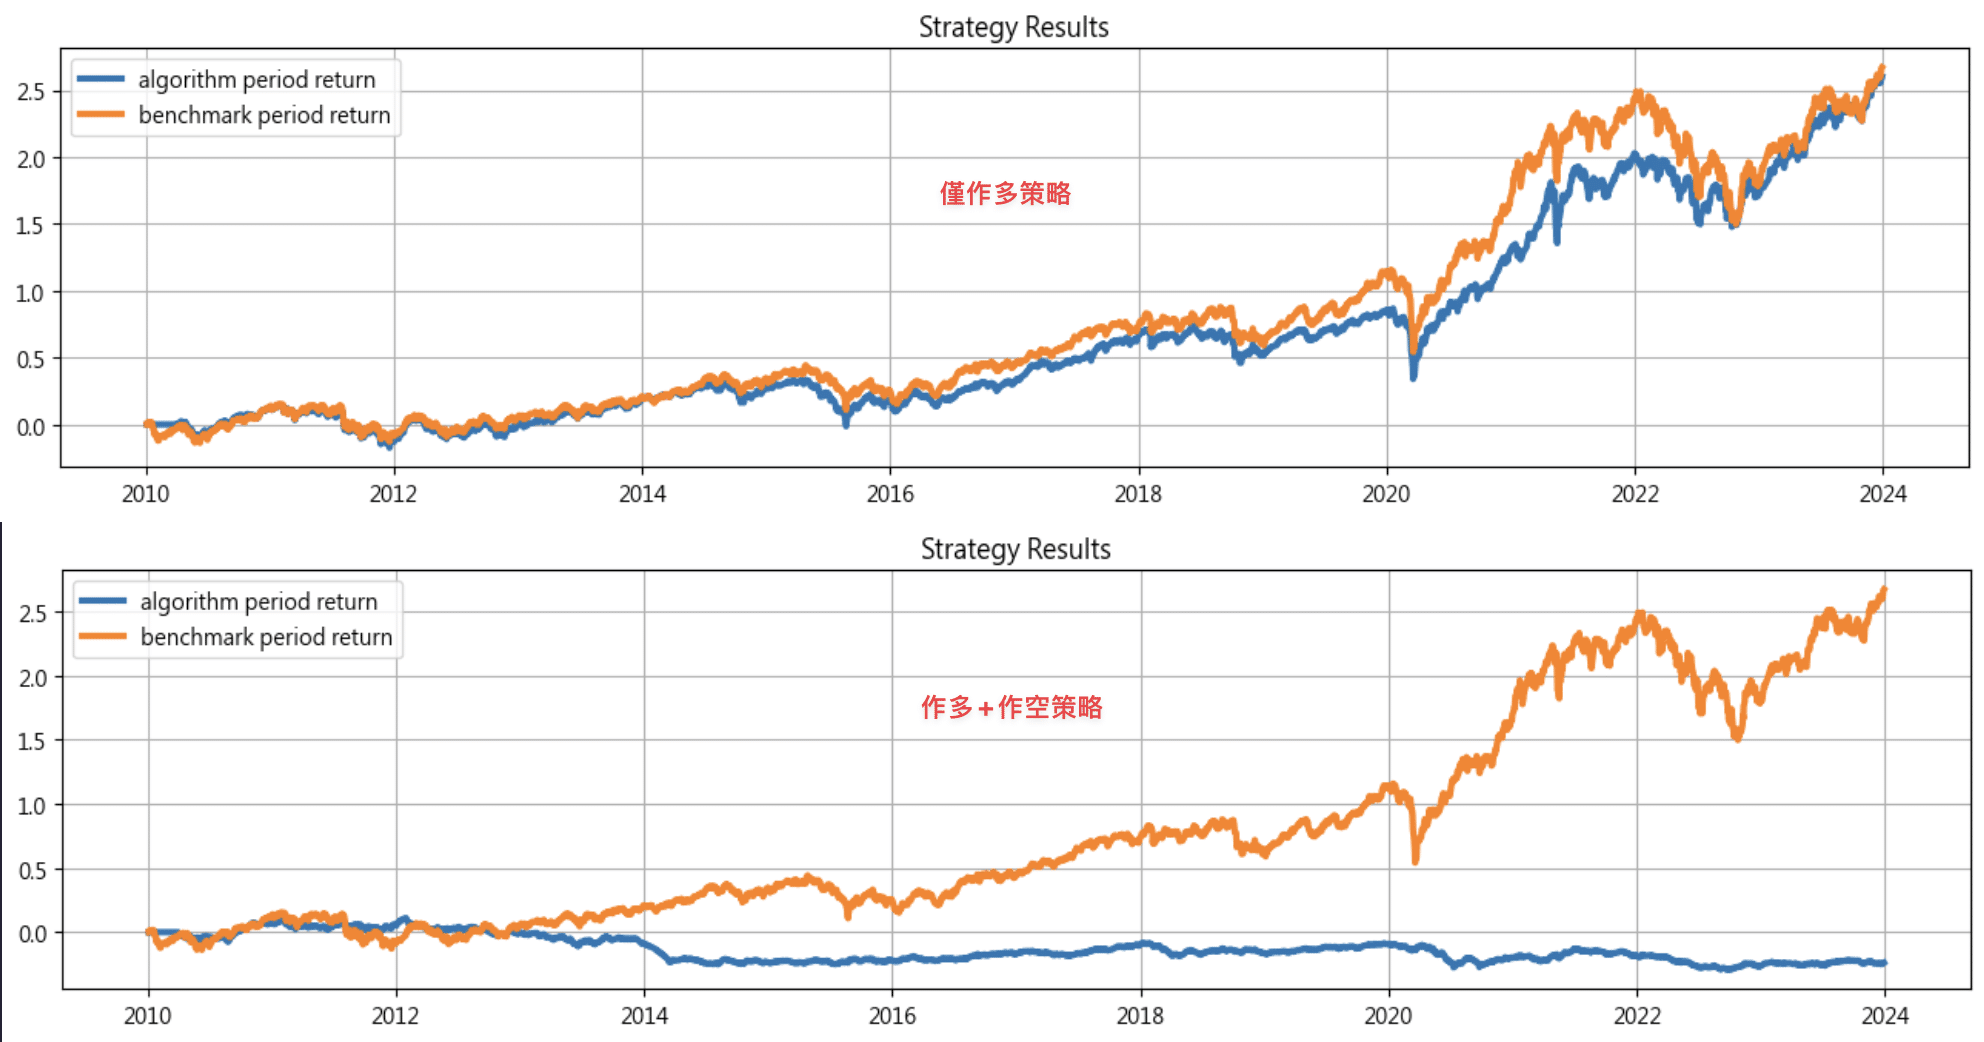
上圖可以看到季報選股僅作多策略在長期回測中表現顯著優於作多加作空策略。前者能夠在牛市環境中穩定增長,創造出超額回報,而後者季報選股則在震盪市場中雖有短期優勢,但未能在長期內有效跑贏基準。筆者推測是因為在大盤很強勢成長的情況下,作空的成效不好,才導致最後幾年的表現相對大盤略為遜色。
本次季報選股策略是一個特別的回測,因為是季營收資訊,所以需要相對長的時間才能有比較顯著的成果。而在股市貧弱的熊市,作空+作多的策略可以獲得較高的獲利;但是在股市強勁的牛市,作多策略更具有優勢,實現較穩定的報酬,但是從 alpha 值也可以看到不會有太多的超額報酬。整體來說雖然在市場波動的情況下持續上升,顯示出穩健的上行趨勢,且風險較低,但需要較長時間才能收到成效的策略。
溫馨提醒,本次策略與標的僅供參考,不代表任何商品或投資上的建議。之後也會持續使用 TEJ 資料庫及 TQuant Lab 來建構各式指標,並回測指標績效,所以歡迎對各種交易回測有興趣的讀者,選購 TQuant Lab 的相關方案,用高品質的資料庫,建構出適合自己的交易策略。