
Table of Contents
對於想使用 TQuant Lab 的同學們來說,除了原本的 GitHub 安裝教學,現在提供了一個更快速、簡潔的方式,讓我們可以在 Google Colab 上直接使用,無需設定虛擬環境,大大降低了使用門檻。
!pip install zipline-tej
ERROR: pip's dependency resolver does not currently take into account all the packages that are installed. This behaviour is the source of the following dependency conflicts.
cudf-cu12 24.4.1 requires pandas<2.2.2dev0,>=2.0, but you have pandas 1.5.3 which is incompatible.
google-colab 1.0.0 requires pandas==2.0.3, but you have pandas 1.5.3 which is incompatible.import os
os.environ['TEJAPI_BASE'] = 'https://api.tej.com.tw'
os.environ['TEJAPI_KEY'] = 'Your_Key'
import datetime
import tejapi
import pandas as pd
import numpy as npfrom zipline.sources.TEJ_Api_Data import get_universe
pool = get_universe(start = '2022-07-02',
end = '2023-07-02',
mkt_bd_e = 'TSE', # 已上市之股票
stktp_e = 'Common Stock', # 普通股
sub_ind_e=['M2324 Semiconductor', 'M2325 Computer and Peripheral Equipment'])import TejToolAPI
start_time = pd.Timestamp('2022-07-02')
end_time = pd.Timestamp('2023-07-02')
data = TejToolAPI.get_history_data(start = start_time,
end = end_time,
ticker = pool,
fin_type = 'A', # 為累計資料,舉例來說,Q3累計:1月~9月的資料。
columns = ['營業總收入'],
transfer_to_chinese = True)
data = data.drop_duplicates(subset=['股票代碼'], keep='last').reset_index(drop=True)
data = data.nlargest(5, '營業總收入_A') #找出最高的5間
data| 股票代碼 | 日期 | 營業總收入_A | |
|---|---|---|---|
| 6 | 2330 | 2023-06-30 | 508632973.0 |
| 90 | 4938 | 2023-06-30 | 318136546.0 |
| 27 | 2382 | 2023-06-30 | 266180950.0 |
| 67 | 3231 | 2023-06-30 | 212000207.0 |
| 4 | 2324 | 2023-06-30 | 209458784.0 |
tickers = data['股票代碼'].unique()start = '2023-07-03'
end = '2024-07-02'
os.environ['mdate'] = start + ' ' + end
os.environ['ticker'] = ' '.join(tickers) + ' ' + 'IR0001'
!zipline ingest -b tquant
from zipline.data import bundles
bundle_data = bundles.load('tquant')
from zipline.api import *
from zipline.finance import commission, slippage
def initialize(context):
context.day = 0
context.tickers = tickers
set_slippage(slippage.VolumeShareSlippage(volume_limit = 0.025, price_impact = 0.1))
set_commission(commission.Custom_TW_Commission(min_trade_cost = 20, discount = 1.0, tax = 0.003))
set_benchmark(symbol('IR0001'))
set_liquidity_risk_management_rule(['全額交割股票(Full-Cash Delivery Securities)', '漲停股票(Limit Up)', '跌停股票(Limit Down)', '開盤即鎖死(Limited Whole Day)'])
def handle_data(context, data):
#回測第一天買進
if context.day == 0:
for ticker in context.tickers:
order_percent(symbol(ticker), 1 / len(tickers))
context.day += 1
import matplotlib.pyplot as plt
capital_base = 1e6 # 設定初始資金
def analyze(context, results):
fig = plt.figure()
ax1 = fig.add_subplot(111)
results['benchmark_cum'] = results.benchmark_return.add(1).cumprod() * capital_base
results[['portfolio_value', 'benchmark_cum']].plot(ax = ax1, label = 'Portfolio Value($)')
ax1.set_ylabel('Portfolio value (TWD)')
plt.legend(loc = 'upper left')
plt.gcf().set_size_inches(18, 8)
plt.grid()
plt.show()
from zipline import run_algorithm
start_date = pd.Timestamp('20230703', tz = 'utc')
end_date = pd.Timestamp('20240702', tz = 'utc') # 轉換成時間序列格式
results = run_algorithm(
start = start_date,
end = end_date,
initialize = initialize,
handle_data = handle_data,
analyze = analyze,
bundle = 'tquant',
capital_base = capital_base,
)
results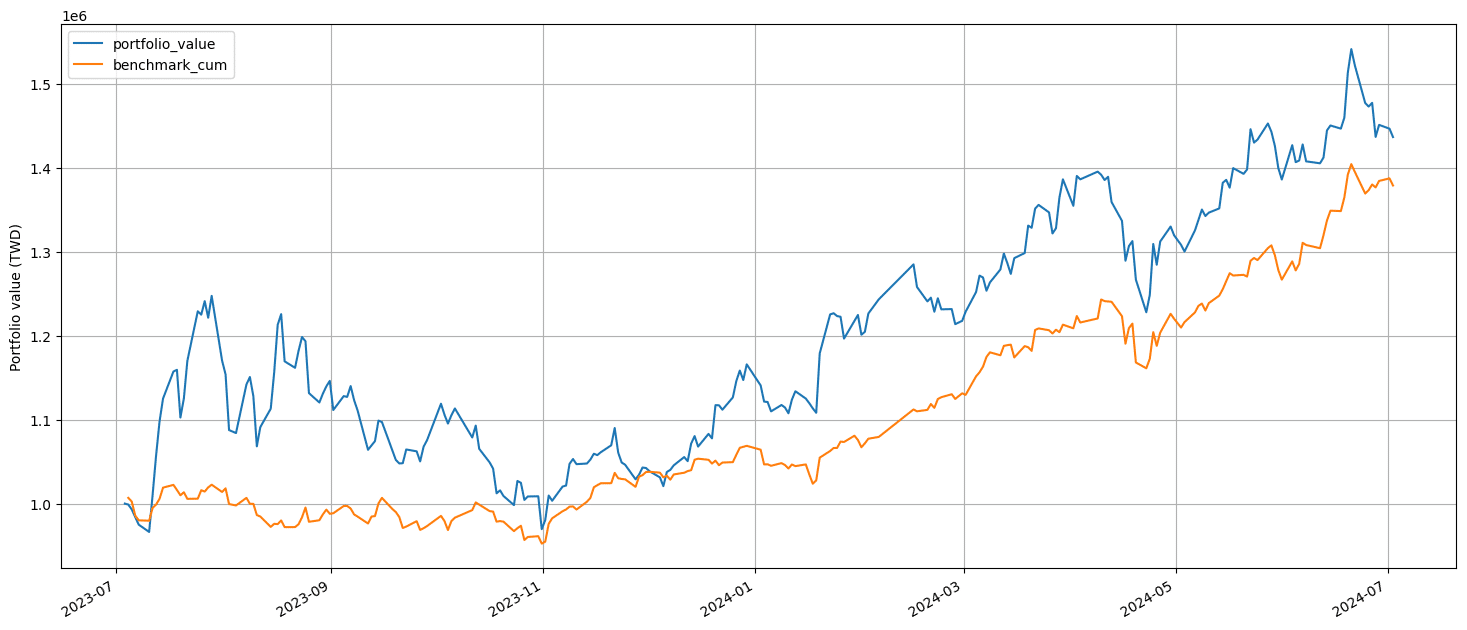
from pyfolio.utils import extract_rets_pos_txn_from_zipline
import pyfolio as pf

# 從 results 資料表中取出 returns, positions & transactions
returns, positions, transactions = extract_rets_pos_txn_from_zipline(results)  # 從 results 資料表中取出 returns, positions & transactions
benchmark_rets = results.benchmark_return  # 取出 benchmark 的報酬率

# 繪製夏普比率圖
from pyfolio.plotting import plot_rolling_sharpe

plot_rolling_sharpe(returns, factor_returns=benchmark_rets)
WARNING:matplotlib.font_manager:findfont: Generic family 'sans-serif' not found because none of the following families were found: Microsoft JhengHei
WARNING:matplotlib.font_manager:findfont: Generic family 'sans-serif' not found because none of the following families were found: Microsoft JhengHei
WARNING:matplotlib.font_manager:findfont: Generic family 'sans-serif' not found because none of the following families were found: Microsoft JhengHei
WARNING:matplotlib.font_manager:findfont: Generic family 'sans-serif' not found because none of the following families were found: Microsoft JhengHei
WARNING:matplotlib.font_manager:findfont: Generic family 'sans-serif' not found because none of the following families were found: Microsoft JhengHei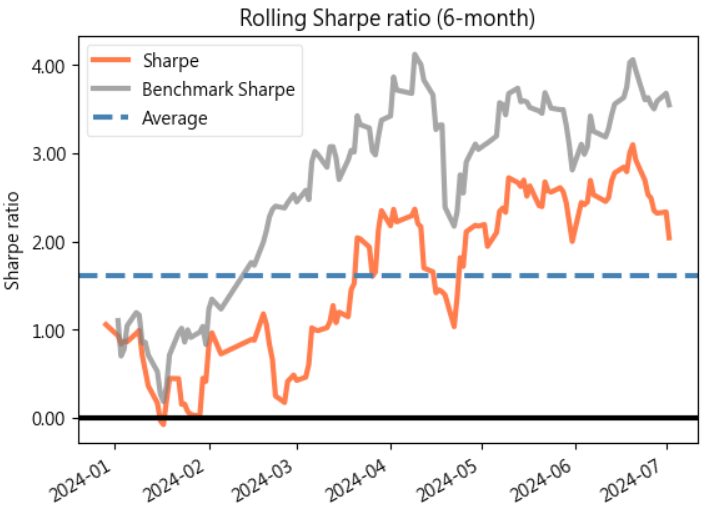
import matplotlib
import matplotlib.font_manager as fm
!wget -O MicrosoftJhengHei.ttf https://github.com/a7532ariel/ms-web/raw/master/Microsoft-JhengHei.ttf
!wget -O ArialUnicodeMS.ttf https://github.com/texttechnologylab/DHd2019BoA/raw/master/fonts/Arial%20Unicode%20MS.TTF

fm.fontManager.addfont('MicrosoftJhengHei.ttf')
matplotlib.rc('font', family='Microsoft Jheng Hei')

fm.fontManager.addfont('ArialUnicodeMS.ttf')
matplotlib.rc('font', family='Arial Unicode MS')plot_rolling_sharpe(returns, factor_returns=benchmark_rets)
本次介紹,在測試的部分幾乎都參考了這篇:『巴菲特選股策略』的代碼內容,如果有任何問題,都可以查看原始延伸閱讀的內容。
另外,這次的介紹讓大家不需額外安裝虛擬環境,一大堆的設定才能使用 TQuant,而是更方便的就可以開始操作,小編認為這是一個非常棒的方式,推薦大家!