

Insights
In-depth research and data-driven insights on quantitative finance, factor investing, risk, and ESG from the TEJ research team.
Trending
Editor's picks from our research desk.

Fundamental Factor Research: Monthly Revenue Information – part1
The Taiwan equity market possesses a rare institutional advantage globally: under the Securities and Exchange Act, listed companies are required to announce and report their operational results for the preceding month by the 10th of each month (Exception: starting from FY2026, insurance companies and entities with insurance subsidiaries may extend their disclosure deadline to the 15th of each month). This is commonly referred to in the market as "Monthly Revenue".
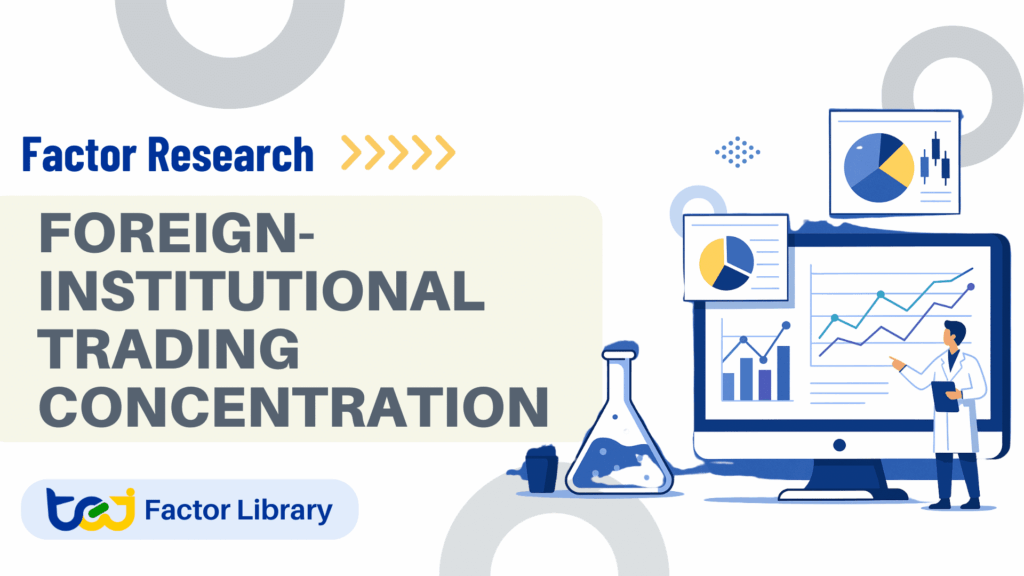
Factor Research – Tracking Smart Money Footprints via Foreign Institutional Concentration – QFII Part 1
Track QFII ‘smart money’ footprints in Taiwan large-cap stocks! Learn how the Foreign-Institutional Trading Concentration (conc_qfii) factor predicts returns.

Empirical Research on Behavioral Factors in the Taiwan Stock Market: A Case Study of the Share Distribution
In an AI-driven Taiwan stock market, mastering chip distribution (ownership structure) is the key to profitability. This study delves into the Share Distribution data from the TDCC, transforming 15 tiers of shareholding data into behavioral finance factors such as investor attention, opinion dispersion, and retail speculation. By utilizing Fama–MacBeth two-stage regression and the alphalens-tej quantitative tool, we precisely validate the predictive power of psychological biases on stock returns, providing investors with actionable Alpha strategies and robust risk management solutions.
Insights
Browse all articles by topic.
 Quant Data Science
TQuant Lab Bollinger Bands Trading Strategy
The Bollinger Bands is a technical indicator invented by John Bollinger in the 1980s. It combines the concepts of moving averages and statistical standard deviation to construct a trading strategy based on statistical analysis. This article will demonstrate how to deploy this strategy on the TQuant Lab back testing platform.
 Industry Insights
Hota (1536.TW): Transferring Power and Driving Force Across Subsidiaries
As a leading manufacturer of automotive gears in Taiwan, how did Hota Group expand its business footprint and lead group members to become a world-class factory?
 Quant Data Science
TQuant Lab MACD Trading Strategy
MACD, which stands for Moving Average Convergence Divergence, is a commonly used tool in technical analysis for measuring the trend changes and momentum of an asset.
 Market Knowledge & Data Guides
Chung Fu’s Delisting Crisis II: Skyrocketing Asset Values and Escalating Ownership Dispute!
Chung Fu has recently been embroiled in multiple governance issues. What secrets lie behind these incidents?
 Quant Data Science
TQuant Lab Rookie Manual
TQuant Lab offers a robust quantitative back-testing system with high precision performance and risk calculations, top-quality data sources, and a highly realistic simulated trading environment. It aids users in swiftly deploying a wide range of trading strategies. Feel free to click into the article to learn more information.
 Market Knowledge & Data Guides
A Brief Overview of Affiliated Companies Disclosures in Annual Shareholder Meetings
Have you noticed “Special Disclosures - Affiliated Companies” in company annual reports? Why do companies include this information, and what’s its significance for them?
 Quant Research
Aroon Up Down Strategy
Oscillator Technical Indicator is a technical indicator used in the financial market analysis for assessing the over-bought/over-sold of a given asset in a given period. It can assist investors in identifying trends and potential trend reversals. Oscillator Technical Indicator processes and converts specific price indicators (e.g., opening, closing, highest, and lowest price) in a limited range. Some may include a negative range. Oscillator Technical Indicators are normally presented in a linear format. Today, we are going to introduce an Oscillator Technical Indicator — Aroon Up Down.
 Industry Insights
Chung Fu’s Delisting Crisis Ⅰ: Repeated Financial Reporting Errors Bring Delisting Closer!
Chung Fu’s operations in peril: critical financial reports repeatedly delayed since last year, what lays behind the reporting delays?
 Market Knowledge & Data Guides
Stewardship Code Resolutions — Taiwan Corporate Shareholder Meetings
As investors, how can we proactively detect potential corporate governance risks earlier through Stewardship Code, beyond relying solely on information from news reports?
 Industry Insights
Will Chinese Car Manufacturers Price War Reverse Demand for Automotive Component Factories?
After the subsidy policies, what impact could the price war waged by Chinese automakers have on Taiwanese automotive component suppliers?
 Event & Alternative Signals
Negative Screening: Striking the Balance Between Your Beliefs and Portfolio Returns
For advocates of negative screening, the most crucial question is how to screen for good companies. Can the selected companies not only align with personal values but also meet returns?
 Industry Insights
The im.B Ponzi Schemes: How to Avoid Being Trapped in “Low-risk, High-return” Schemes?
As investors, what can we learn from such a meticulously crafted ponzi scheme by im.B fraud?