
Photo by Carlos Muza on Unsplash
Table of Contents
The rapid global development of the AI industry has placed Taiwan, with its electronics industry core, in a pivotal role for technical R&D and production. This has increased the visibility of Taiwan’s capital market and attracted more international and domestic investors. Consequently, exploring the relationship between investor trading behavior and expected stock returns has become a critical issue.
Behavioral finance theory suggests that investors are not perfectly rational, and their decisions are often influenced by psychological biases that lead to irrational behaviors and asset prices deviating from fundamental values. To capture these characteristics, this study constructs proxy variables as factors to examine the relationship between investor behavior and expected stock returns.
The Share Distribution table published by the Taiwan Depository & Clearing Corporation provides a vital perspective for observing investor behavior. This data classifies investors into 15 groups based on the number of K shares held and discloses information such as the shareholding ratio, number of K shares, and number of shareholders for each group.
This study utilizes Share Distribution data to construct multiple investor trading behavior factors, including changes in ownership breadth, investor attention, opinion dispersion, changes in ownership dispersion, trading crowding, and retail trading speculation. The goal is to verify the predictive power of these factors on future stock returns using Fama–MacBeth two-stage regression and portfolio analysis. Furthermore, the alphalens-tej factor analysis tool is used to evaluate the tradability of these signals to serve as a basis for factor investment strategies and portfolio management.
Investors are categorized by their holdings: Blockholders are represented by those holding 100 K shares or more shares, while Retail Investors are those holding 10 K shares or fewer shares. 8 behavioral factors were constructed:
Table 1: Definition of Behavioral Factors
| English Factor Name | Calculation Method | Key Description |
| Change in Blockholder Ownership Breadth | Change in the shareholding ratio of shareholders holding 100+ K shares over the past 13 weeks. | Ownership breadth refers to the number of investors holding long positions in a stock, reflecting the degree of investor optimism toward that stock. |
| Change in Retail Ownership Breadth | Change in the shareholding ratio of shareholders holding 10 or fewer K shares over the past 13 weeks. | Tracks the participation breadth of retail investors. |
| Change in Ownership Dispersion | Change in “Average Shares Held” (= Total shares held by all shareholders ÷ total number of shareholders) over the past 13 weeks. | Uses average shares held to observe the concentration or dispersion of the Share Distribution. An increase represents relative concentration, while a decrease represents relative dispersion. |
| Overall Shareholder Attention | Total number of shareholders ÷ average number of shareholders over the past 52 weeks. | Under limited attention, investors prioritize stocks that attract their notice, which in turn drives trading volume. |
| Retail Investor Attention | Number of shareholders holding 10 or fewer K shares ÷ average number of the same group over the past 52 weeks. | Specifically measures the attention levels of retail investors. |
| Blockholder Opinion Dispersion | Standard deviation of weekly changes in the shareholding ratio of shareholders holding 100+ K shares. | Investors often have different evaluations of the same information due to heterogeneous beliefs. This factor measures the divergence of opinions among blockholders through the dispersion of their holding changes. |
| Retail Investor Crowding | Number of shares held by shareholders with 10 or fewer K shares ÷ cumulative trading volume of the current week. | This factor aims to capture market crowding caused by concentrated retail trading and measures the market depth and liquidity required for retail investors to liquidate their positions. |
| Retail Trading Speculation | The difference between the current shareholding ratio of shareholders holding 10 or fewer K shares and their average shareholding ratio over the past 52 weeks. | Speculative trading behavior by retail investors is typically negatively correlated with future stock returns |
The previous section constructed 8 behavioral factors. This section analyzes the predictive power of these factors on the cross-section of expected stock returns. This study employs Fama–MacBeth regression (hereafter referred to as FM regression), supplemented by Portfolio Sorts, to examine the predictive power of each behavioral factor for stock returns over the following week. This assesses their information content in the cross-section and serves as a foundation for subsequent tradability analysis.
This subsection uses FM regression to test the cross-sectional predictive power of behavioral factors on stock returns. At the end of each week, the study calculates the factor values for each security in the stock pool and their returns for the following week. Control variables, including short-term momentum (returns over the past month), size effect (market value), and valuation factors (Book-to-Price ratio), are included to exclude the influence of known risk factors.
Table 2 presents the FM regression results for each behavioral factor. The empirical results show that the average regression coefficients for each factor range between -0.0028 and 0.0066. This means the sensitivity of the next week’s stock return to a one-unit change in the current factor is approximately between -0.28% and 0.66%. Furthermore, the p-values for all factors are below 0.1, indicating that behavioral factors possess statistically significant predictive power for stock returns.
Regarding Positive Predictors, ranked by the significance level of their t-statistics, they are: “Change in Ownership Dispersion,” “Change in Blockholder Ownership Breadth,” and “Blockholder Opinion Dispersion“. Their coefficients all show a significant positive correlation at the 5% significance level.
Regarding Negative Predictors, ranked by the significance level of their t-statistics, they are: “Retail Trading Speculation,” “Change in Retail Ownership Breadth,” “Retail Investor Attention,” and “Overall Shareholder Attention“. Their coefficients all show a significant negative correlation at the 1% significance level.
Table 2: FM Regression Results for Behavioral Factors
Overall, the FM regression results confirm that the behavioral factors constructed in this study possess significant predictive power for the cross-section of stock returns.
Compared to FM regression, which must be built on linear assumptions, the advantage of portfolio analysis lies in its ability to capture non-linear relationships between factors and stock returns. At the end of each week, this study ranks stocks based on factor values and divides them equally into ten decile groups (quantiles). Each group is configured with equal weighting and rebalanced after a one-week holding period. The predictive power of the behavioral factors for the following week’s returns is evaluated by observing the return monotonicity from low (Q1) to high (Q10) factor values, as well as the performance of the High-minus-Low (H-L) long-short portfolios.
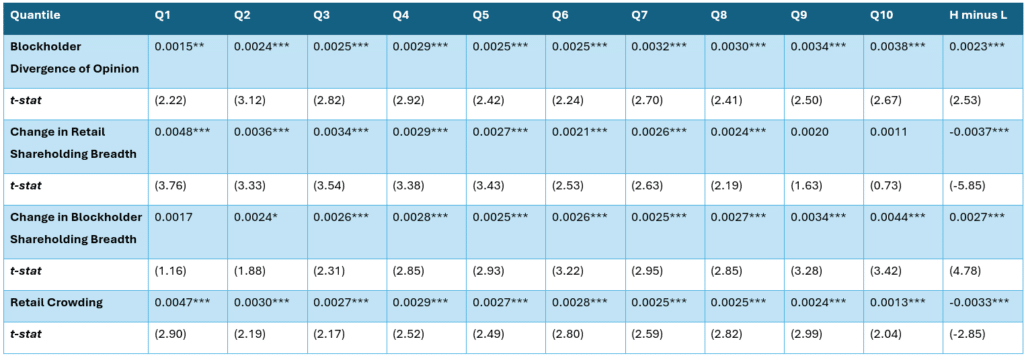
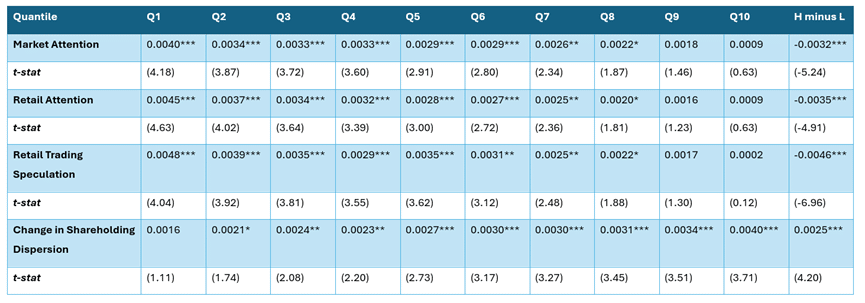
The empirical results in Table 3 show that the portfolio returns for “Change in Blockholder Ownership Breadth,” “Change in Ownership Dispersion,” and “Blockholder Opinion Dispersion” mostly exhibit an increasing trend, indicating that these factors have positive predictive power. Among them, the weekly returns of the H-L (long-short hedge) portfolios for the first two factors were 0.27% ($t=4.78$) and 0.25% ($t=4.2$), respectively, with p-values reaching the 1% significance level. This demonstrates that blockholder accumulation and the shift of Share Distribution from dispersion to concentration possess a significant positive information advantage in the Taiwan stock market.
On the other hand, the portfolio returns for “Retail Trading Speculation,” “Change in Retail Ownership Breadth,” “Retail Investor Attention,” “Retail Investor Crowding,” and “Overall Shareholder Attention” exhibit a decreasing trend, indicating a negative correlation between these behavioral factors and expected stock returns. Specifically, the weekly returns of the H-L (long-short hedge) portfolios for these factors were -0.46% (t=-6.96), -0.37% (t=-5.85), -0.35% (t=-4.91), -0.33% (t=-2.85), and -0.32% (t=-5.24), respectively, with p-values all reaching the 1% significance level. This indicates that excessive retail participation or overheated speculative sentiment is often followed by a subsequent return reversal, confirming that retail investors play the role of “information laggards” in the market and that their behavioral characteristics possess significant contrarian predictive value.
Table 3: Portfolio Returns by Behavioral Factor Quantile
Combining the results of the FM regression and portfolio analysis, all 8 behavioral factors constructed in this study can effectively predict the expected returns of stocks. Among them, the “Retail Trading Speculation” factor demonstrates the most significant overall predictive power. Therefore, the following section will use this factor as an example to further evaluate its predictive power and signal tradability using the alphalens-tej tool.
The previous section employed FM regression and portfolio analysis to examine the cross-sectional predictive power of the factors. This section utilizes the alphalens-tej factor analysis tool to further explore the relationship between the Retail Trading Speculation factor and expected stock returns. Specifically, this section evaluates the factor’s ability to predict stock returns across three dimensions: factor performance, information coefficient (IC), and turnover rate.
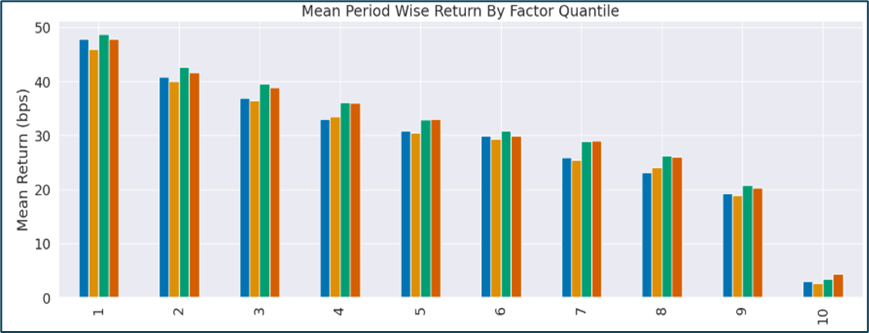
Factor performance analysis primarily uses factor ranking to divide stocks into groups and construct equal-weighted portfolios to observe whether a monotonic relationship exists between the average return over different holding periods and the factor rankings. Observing the results in Figure 4, when the stock pool is divided into 10 equal groups based on the Retail Trading Speculation factor with equal-weighting, a clear monotonic decreasing relationship is observed between the future average returns and the groups across all holding periods: 1 week (blue bars), 2 weeks (yellow bars), 3 weeks (green bars), and 4 weeks (red bars). Furthermore, the average return of Group 10 (Top group) is significantly lower than that of Group 1 (Bottom group). This not only demonstrates a negative relationship between the Retail Trading Speculation factor and future stock
Figure 4: Average Returns by Retail Trading Speculation Factor Quantiles
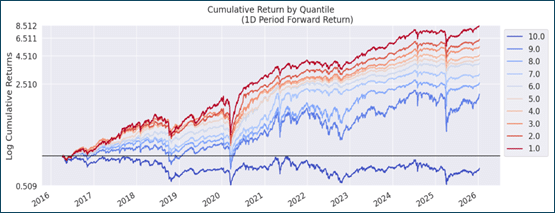
In addition to observing average returns, Figure 5 further illustrates the time-series performance of the cumulative returns for each portfolio quantile. The results show that the Bottom group (Group 1)—consisting of stocks with Retail Trading Speculation factor values in the lowest 10th percentile—consistently outperformed all other groups in terms of cumulative returns. Conversely, the Top group (Group 10)—stocks with factor values in the highest 90th percentile—consistently lagged behind the others. This indicates that the predictive power of the Retail Trading Speculation factor demonstrates a high degree of stability and consistency over time.
Figure 5: Cumulative Returns by Retail Trading Speculation Factor Quantiles
The Information Coefficient is the Spearman rank correlation coefficient between a factor and future stock returns, commonly referred to as IC. When the IC is greater than 0, it indicates a positive correlation between the factor and future stock returns; conversely, an IC less than 0 indicates a negative correlation.
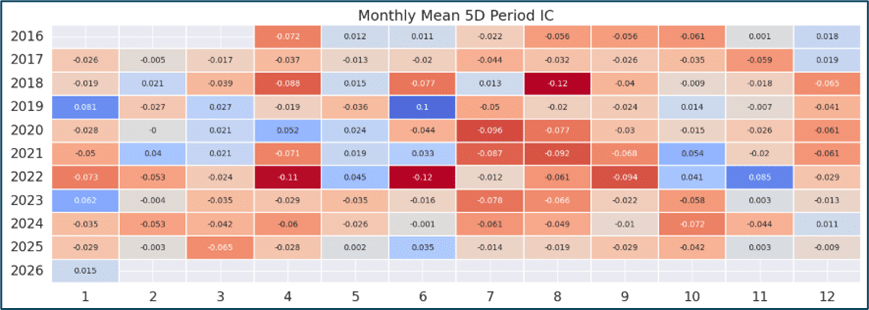
Figure 6 presents a heatmap of the monthly average of weekly IC values for the Retail Trading Speculation factor from 2016 to 2026. This chart shows that the IC was negative for most months, with a mean of approximately -0.03, representing a negative relationship between the factor and future stock returns. It is worth noting that extreme positive IC values occurred in a few specific months—for example, the first half of 2019, March to May 2020, the first half of 2021, and October to November 2022. These instances suggest that specific market environments caused the negative relationship to reverse. Using this factor as a stock selection metric for investment strategies during such periods would have resulted in a significant negative impact on portfolio profit and loss.
Figure 6: Weekly IC Values for the Retail Trading Speculation Factor
The previous analysis of the Retail Trading Speculation factor’s predictive power did not account for transaction costs such as commissions and slippage. However, in actual investing, transaction costs play a critical role in the success or failure of an investment strategy. Therefore, this subsection performs a turnover rate analysis to estimate the potential transaction fees incurred when constructing a portfolio using this factor.
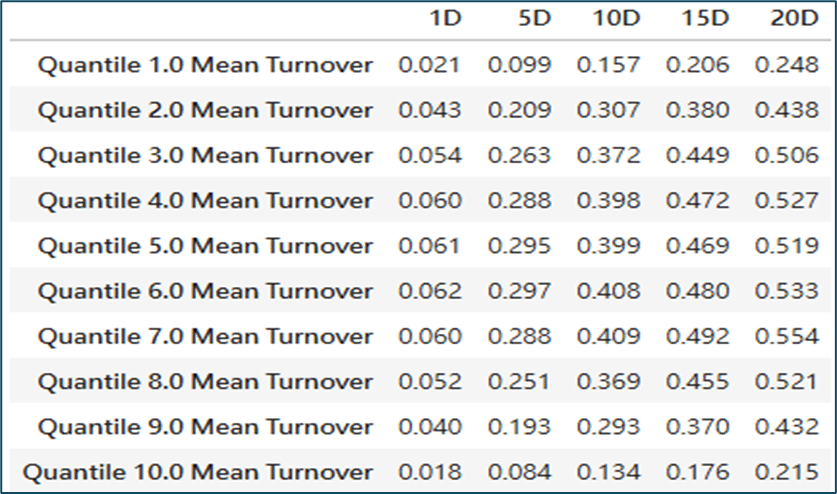
Generally, the turnover rate represents the frequency of stock replacement; a turnover of 1x indicates that the portfolio’s stock list has been replaced once, while an annualized turnover of 12x is equivalent to replacing the stocks every month. Table 7 shows that the average weekly (5 days) turnover rates for the Top and Bottom quantile portfolios are approximately 9.9% and 8.4%, respectively, which annualize to roughly 5.15x and 4.37x. Overall, the turnover rate is low, indicating that the frequency of stock replacement is not high. Consequently, for an investment strategy built on this factor, the impact of transaction fees on investment profits remains limited.
Table 7: Average Turnover Rates for the Retail Trading Speculation Factor (Holding Periods: 1D, 5D, 10D, 15D, 20D)
Comprehensive analysis of factor performance, Information Coefficient (IC), and turnover rates indicates that the “Retail Trading Speculation” factor maintains a negative relationship with future stock returns, with its time-series performance demonstrating significant stability and consistency. Consequently, this relationship can be effectively utilized to predict future stock returns. Furthermore, due to its low turnover rate and the resulting limited transaction costs, this factor is highly suitable as a stock selection indicator for medium-to-long-term investors when constructing investment portfolios.
This study utilized Share Distribution data from the Taiwan Depository & Clearing Corporation to construct 8 behavioral factors, exploring the relationship between investor trading behavior and expected stock returns in the Taiwan market.
Empirical results indicate that most behavioral factors possess significant predictive power for stock returns over the following week. Notably, the quantile returns for Blockholder behavioral factors exhibit an increasing trend relative to factor rankings, demonstrating that the investment behavior of large shareholders holds a positive information advantage in the Taiwan stock market. Conversely, the quantile returns for Retail Investor behavioral factors show a decreasing trend, reflecting their contrarian predictive characteristics. Among all behavioral factors, “Retail Trading Speculation” demonstrated the strongest overall predictive power. Further observation shows that this factor’s quantile returns are stable and consistent over time, its IC value is significantly negative, and its turnover rate is low, making it a suitable core indicator for medium-to-long-term quantitative selection models.
Overall, the investor behavioral factors constructed in this study—whether tested through FM regression, portfolio analysis, or the alphalens-tej factor analysis tool—show strong predictive power for expected stock returns. Share Distribution data allows for more than just observing changes in ownership structure; it can be further transformed into quantitative investment factors with significant informational value. In the future, investors and researchers can utilize TEJ-related databases and the methodologies presented in this study to further uncover information-rich investment factors in the Taiwan market, serving as a reference for factor investment strategy design and portfolio management.
