Skip to content
About
News
Solution&DataSets
Taiwan Stock Data Solutions
Fundamental Data
Financial Data
Event-Driven Data
Market Data
Quantitative Finance Solution
Factor Library
Quantitative Investment Database
Credit Risk Solution
TCRI™_Taiwan Corporate Credit Risk Index
TCRI™ Watchdog
ESG Sustainability Solution
TESG Rating
TESG Event Radar
Valuation Analytics Solution
Product Introduction
Insights
Supports
Service Provide Method
FAQ
Learning Video
Factor White Paper
繁體中文
English
Contact Us
Home
>
Insight
>
Page 17
Insights
Provide the latest financial news to help you easily stay informed.
All Categories
All Categories
Data Analysis
Fintech練功坊
Market Research
TQuant Lab
09
/
12
2023
TQuant Lab Bollinger Bands Trading Strategy
The Bollinger Bands is a technical indicator invented by John Bollinger in the 1980s. It combines the concepts of moving averages and statistical standard deviation to construct a trading strategy based on statistical analysis. This article will demonstrate how to deploy this strategy on the TQuant Lab back testing platform.
09
/
07
2023
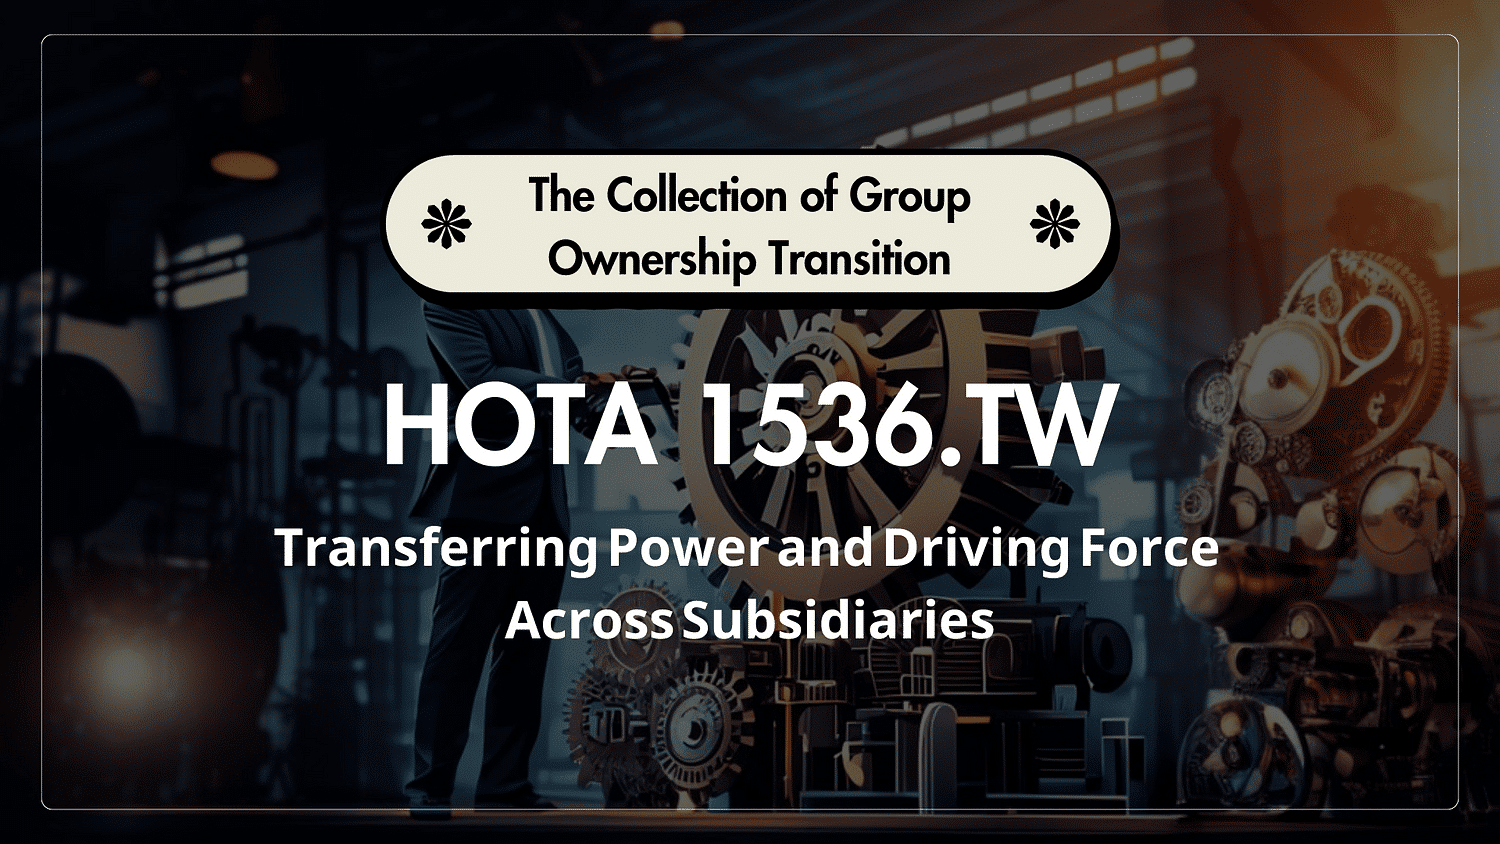
Hota (1536.TW): Transferring Power and Driving Force Across Subsidiaries
As a leading manufacturer of automotive gears in Taiwan, how did Hota Group expand its business footprint and lead group members to become a world-class factory?
09
/
05
2023
TQuant Lab MACD Trading Strategy
MACD, which stands for Moving Average Convergence Divergence, is a commonly used tool in technical analysis for measuring the trend changes and momentum of an asset.
09
/
01
2023
Chung Fu’s Delisting Crisis II: Skyrocketing Asset Values and Escalating Ownership Dispute!
Chung Fu has recently been embroiled in multiple governance issues. What secrets lie behind these incidents?
08
/
29
2023
TQuant Lab Rookie Manual
TQuant Lab offers a robust quantitative back-testing system with high precision performance and risk calculations, top-quality data sources, and a highly realistic simulated trading environment. It aids users in swiftly deploying a wide range of trading strategies. Feel free to click into the article to learn more information.
08
/
24
2023
A Brief Overview of Affiliated Companies Disclosures in Annual Shareholder Meetings
Have you noticed "Special Disclosures - Affiliated Companies" in company annual reports? Why do companies include this information, and what's its significance for them?
08
/
22
2023
Aroon Up Down Strategy
Oscillator Technical Indicator is a technical indicator used in the financial market analysis for assessing the over-bought/over-sold of a given asset in a given period. It can assist investors in identifying trends and potential trend reversals. Oscillator Technical Indicator processes and converts specific price indicators (e.g., opening, closing, highest, and lowest price) in a limited range. Some may include a negative range. Oscillator Technical Indicators are normally presented in a linear format. Today, we are going to introduce an Oscillator Technical Indicator — Aroon Up Down.
08
/
17
2023
Chung Fu’s Delisting Crisis Ⅰ: Repeated Financial Reporting Errors Bring Delisting Closer!
Chung Fu's operations in peril: critical financial reports repeatedly delayed since last year, what lays behind the reporting delays?
08
/
10
2023
Stewardship Code Resolutions — Taiwan Corporate Shareholder Meetings
As investors, how can we proactively detect potential corporate governance risks earlier through Stewardship Code, beyond relying solely on information from news reports?
<
1
…
15
16
17
18
19
…
29
>
Processing...