
Table of Contents
In financial markets, Contrary Thinking is a timeless strategic wisdom. It stems from a simple yet profound observation: when most people are overly optimistic, the market is often overheated; when the crowd falls into fear, it may actually present a buying opportunity. However, contrarian investing has long remained at the level of a proverb, lacking concrete and quantifiable standards of action, making it difficult to implement in practice.
Anthony M. Gallea and William Patalon III, in their book Contrarian Investing, were the first to translate contrarian strategies into executable, quantitative stock-picking methods. Gallea, a Senior Portfolio Management Director at Salomon Smith Barney, led a team of more than 14 professionals managing over $600 million in assets. Patalon, an experienced business journalist, is a four-time recipient of the New York State Associated Press Business Writing Award. Together, they leveraged their extensive practical and observational experience to construct a stock selection methodology that combines theoretical depth with practical applicability.
This strategy employs a multi-layered screening logic that integrates technical, ownership, and fundamental factors to identify stocks with medium-term growth potential.
First, on the technical side, it screens for stocks whose closing price over the past year is less than 50% of their 12-month high, treating them as candidates with potential for reversal momentum.
Next, under ownership conditions, if directors or executives have increased their holdings by at least 5% in the past six months, or their shareholding has already reached over 10%, the stock is considered as having clear insider confidence and is included in the selection. In addition, significant buying activity from institutional investors carries the same weight.
If the ownership conditions are satisfied, the company is further evaluated for fundamental advantages, requiring it to meet at least two of the following four criteria:
After selecting the target stocks, the total capital is allocated on an equal-weighted basis to achieve risk diversification and to avoid concentrating excessive funds in a single stock.
| Data Code | close_d | adjfac | fld005 | qfii_pct | fd_pct | ri |
| Field Name | Closing Price | Adjustment Factor | Director Shareholding % | Foreign Institutional Ownership % | Mutual Fund Ownership % | Recurring Income |
| Data Code | shares | per | cscfo | cscfi | r307 | r19 | open_d |
| Field Name | Outstanding Shares | P/E Ratio | Operating Cash Flow | Investing Cash Flow | Net Asset Value per Share | Revenue per Share (TTM) | Opening Price |
| Performance Metric / Strategy | Benchmark | This Investment Strategy |
| Annualized Return | 13.91% | 14.53% |
| Cumulative Return | 156.29% | 166.60% |
| Annualized Volatility | 17.54% | 23.93% |
| Sharpe Ratio | 0.83 | 0.69 |
| Calmar Ratio | 0.51 | 0.33 |
| Maximum Drawdown (During Period) | -27.37% | -43.47% |
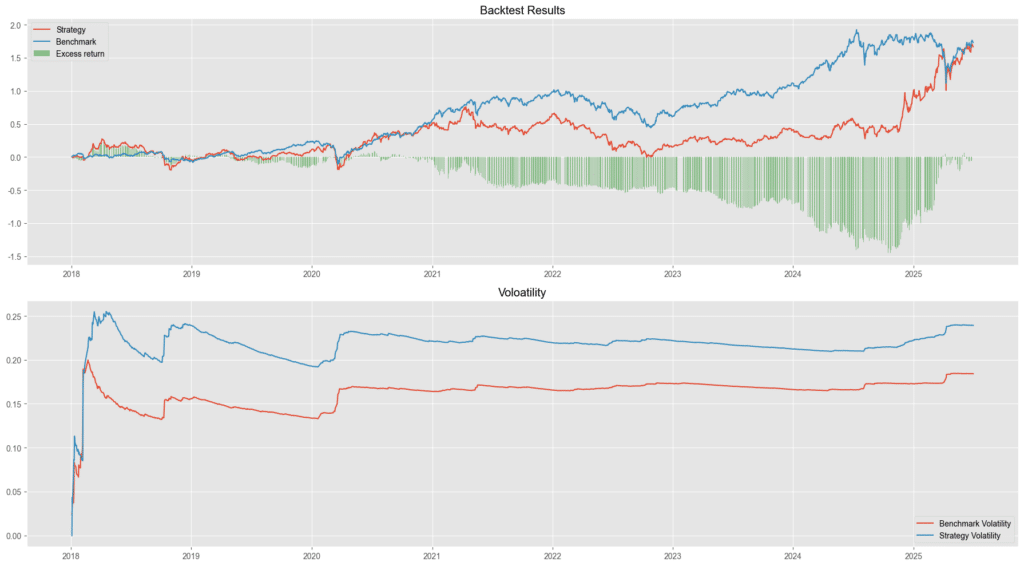
Based on the backtesting results, this investment strategy slightly outperforms the market in terms of annualized return (14.53%) and cumulative return (166.6%), compared to the benchmark’s 13.91% / 156.29%.
However, its risk-adjusted performance is relatively poor. The strategy’s annualized volatility reaches 23.93%, significantly higher than the market’s 17.54%, resulting in a Sharpe ratio of only 0.69, which is lower than the market’s 0.83. This indicates that the return per unit of risk is actually worse.
In addition, the strategy suffers from a maximum drawdown of -43.47%, compared to the market’s -27.37%, reflecting a lack of sufficient defensive capability during periods of market turbulence.
The Calmar Ratio of the strategy is 0.33, also lower than the market’s 0.51, suggesting that the return achieved for each unit of maximum loss is relatively low.
This is also evident in the chart, where the “Excess Return” remains negative for a prolonged period, especially between 2021 and 2024, during which the strategy clearly underperformed the market.
We welcome all investors and interested readers to review this strategy.
We will continue to share insights on building various indicators using the TEJ database, as well as backtesting their performance. If you’re interested in quantitative trading and strategy development, consider subscribing to the TQuant Lab solutions — use high-quality data to build strategies tailored to your own investment style.
📌 Disclaimer:
This analysis is for informational purposes only and does not constitute investment advice or recommendations for any specific financial product.
【TQuant Lab Backtesting System】Solving Your Quantitative Finance Pain Points
From Business Cycle Indicators to Asset Rotation: A Quantitative Strategy to Avoid Bear Markets
Michael Murphy’s Risk Assessment Rules for Investing in High-Tech Stocks
Charles Brandes’ Value Investing Principles : Building a Portfolio with a Margin of Safety
