Table of Contents
In TCRI Watchdog Part 1: How Major Announcements Drive Stock Price Volatility, we demonstrated that Taiwan’s equity market exhibits a clear and asymmetric reaction to corporate announcements: negative events lead to stronger and more persistent price declines, and much of this movement occurs even before the information is officially disclosed. Using TCRI Watchdog’s Event Intensity framework, we quantified how different levels of negative and positive signals translate into abnormal returns, revealing the market’s behavioral patterns across the event window.
Building on these findings, Part 2 examines whether all types of announcements generate the same level of market impact—or whether certain categories carry far greater influence.TCRI Watchdog classifies all events into 5 major categories: Accounting, Industry Prospects, Management & Governance, Market Transactions, and Crisis Events. Each category reflects a different dimension of corporate fundamentals or risk, and the market reacts to them in meaningfully different ways.
In the following sections, we analyze how each category affects stock prices, compare their reaction magnitudes and persistence, and highlight which types of information serve as the most important early-warning signals for investors.
➡️ Part1: How Major Announcements Drive Stock Price Volatility
To further understand how markets differentiate between event types, the five TCRI WD types were compared, the analysis of event quantity and event score is shown in Figure 1:
Figure 1:Event Distribution Chart
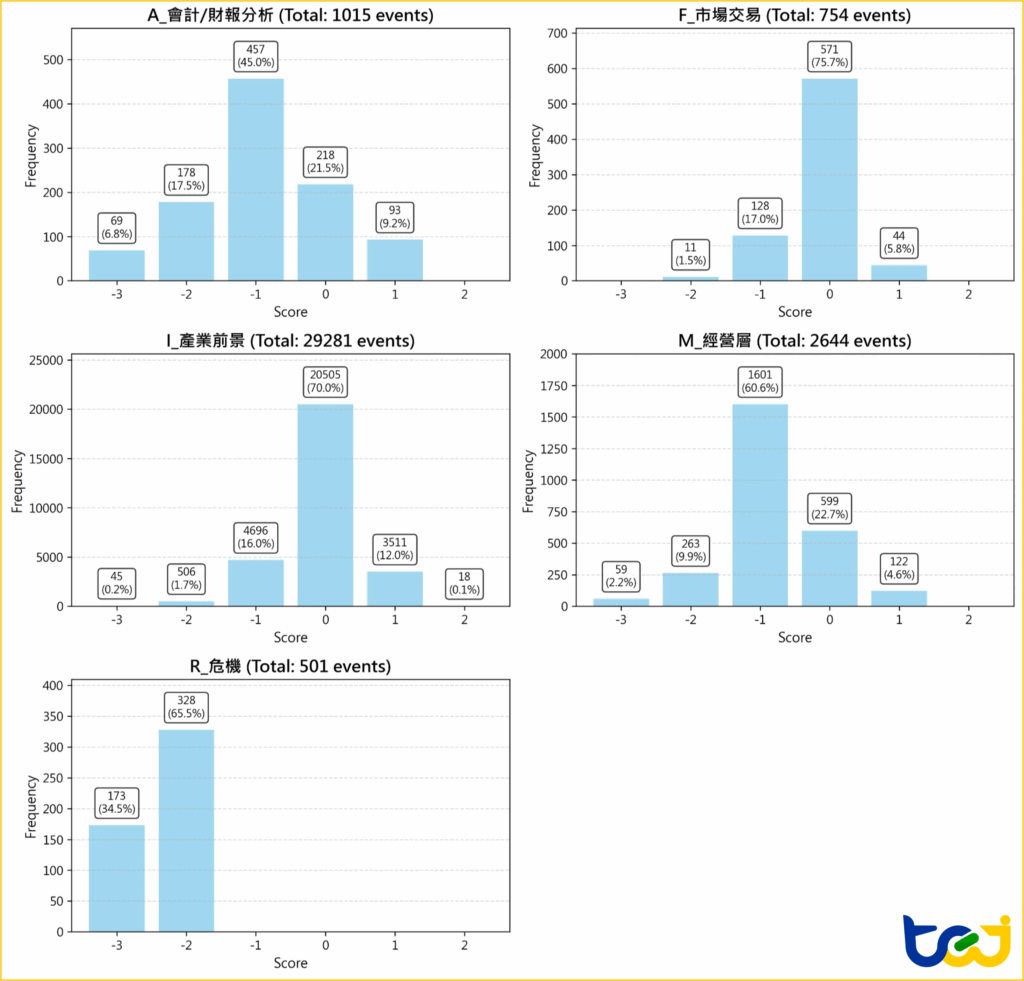
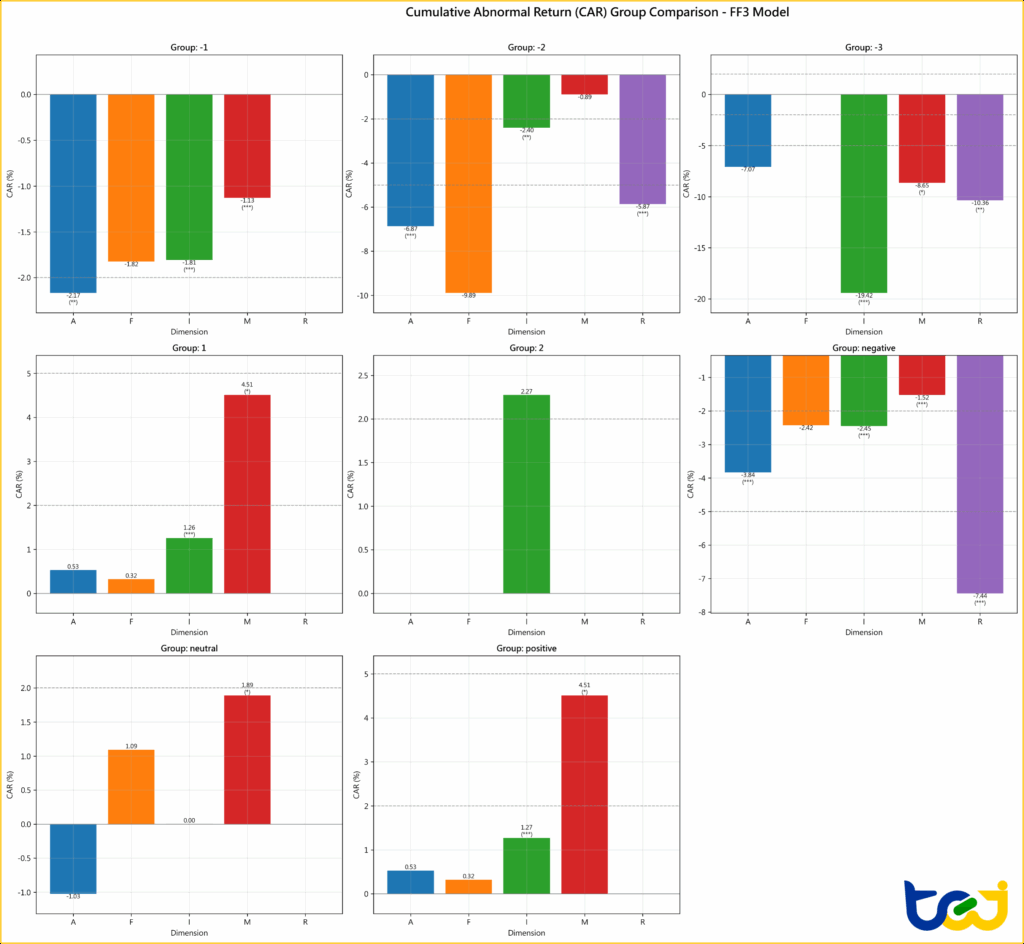
Figure 2:CAAR (T+10) Group Comparison Chart
👉 Meet TEJ at New York Winter Data Summit 2025
This category primarily includes events such as financial statement delays, changes in auditor policies, and financial restatements or revisions. Overall, the market’s interpretation of these events is distinctly negative. Within the negative group, market reactions exhibit a clear “monotonic decline”: the CAAR decreases from –2.17% in the –1 group to –7.07% in the –3 group, although the –3 result is not statistically significant.
In contrast, the positive group records only a mild rebound of +0.53%—a result that is also statistically insignificant—indicating that any potential favorable impact is very limited.
Industry-related announcements represent the largest event category among the five, covering operations, production, R&D progress, workforce adjustments, capital raising, and regulatory compliance. Events in this category exhibit the most substantial and persistent market reactions.
For example, –3 intensity events show a striking CAAR of –19.42%, indicating that when industry outlook deteriorates or operational momentum weakens, investors respond with collective risk-averse behavior.
In contrast, positive events have relatively limited upward impact—+2 events show a CAAR of only about +2.27%, reflecting the market’s more moderate response to favorable information.
Overall, Industry Prospect events best reflect shifts in market sentiment, displaying characteristics of high volatility and strong persistence.
Table 1:Detailed Statistical Results of I type events
| Group | Event Count | Mean AAR (%) | Final CAAR (%) | Significance |
|---|---|---|---|---|
| -1 | 4696 | -0.09% | -1.81% | *** |
| -2 | 506 | -0.11% | -2.40% | *** |
| -3 | 45 | -0.91% | -19.42% | *** |
| 1 | 3511 | 0.06% | 1.26% | *** |
| 2 | 18 | 0.11% | 2.27% | |
| negative | 5247 | -0.12% | -2.45% | *** |
| neutral | 20505 | -0.00% | 0.00% | |
| positive | 3529 | 0.06% | 1.27% | *** |
This category primarily includes events such as senior management changes, shifts in control rights, internal-control deficiencies, and social controversies. Category M generates the strongest positive market reaction among all event types. The positive group exhibits a CAAR of +4.51%, the highest across all categories. Even the neutral group shows a meaningful positive return of +1.89%, suggesting that investors generally view M-type events as opportunities for operational improvement or governance enhancement.
Although the negative group shows a moderate decline of –1.52%, the overall pattern remains predominantly positive. Notably, the –3 group registers a significant drop of –8.65%, yet this does not overturn the broader tendency for M-type events to elicit net favorable market responses.
This category primarily includes events such as rating changes, abnormal price volatility, and insider trading–related issues. Market reactions to these events are more mixed and lack a clear directional pattern. Interestingly, the neutral group’s CAAR (+1.09%) exceeds that of the positive group (+0.32%), suggesting that investors do not share a consistent expectation regarding F-type events. Within the negative group, the total CAAR is –2.42%, indicating only a mild adverse response. Although the –2 group shows a sharp decline of –9.89%, the small sample size (N = 11) limits its interpretability.
Overall, none of the CAAR results across F-type subgroups are statistically significant, indicating that the market impact of these events is generally weak and inconsistent.
R. Crisis Precursor
Crisis-related events involve TCRI downgrade, defaults, delistings, financial restructuring, and penalties imposed by regulatory authorities. This category is the most directly tied to credit risk within the TCRI Watchdog .
The market reaction to R-type events is both severe and highly persistent. Events in the –2 group show a CAAR of –5.87%, and the –3 group declines significantly further to –10.36%. Moreover, the downward trend continues from t+6 to t+9, showing a clear post-event drift effect.
These results underscore that crisis-related disclosures serve as early warning indicators of deteriorating credit quality, making them especially valuable for credit risk monitoring and bond investment strategies.
Table 2:Detailed Statistical Results of R type events
| Group | Event Count | Mean AAR (%) | Final CAAR (%) | Significance |
|---|---|---|---|---|
| -2 | 328 | -0.27% | -5.87% | *** |
| -3 | 173 | -0.47% | -10.36% | *** |
| negative | 501 | -0.34% | -7.44% | *** |
Event Impact (AAR):
From the top-left AAR chart and the AR t-statistic panel, the announcement day (t=0) shows a clear pattern: the stronger the negative intensity (–1, –2, –3), the larger the abnormal drop in stock prices. The –3 group (dark blue line) experiences the steepest one-day decline, indicating the most severe market reaction.
Cumulative Effect (CAR):
The top-right CAR chart illustrates a pronounced post-event drift for negative events. The –3 group continues to fall after t=0, ultimately reaching nearly –20% by day t+10, while the –2 and –1 groups show much milder declines.
Statistical Significance:
The CAR t-statistic panel confirms that these declines are not random. The –1, –2, and –3 groups remain below the –2 t-value threshold after the announcement, indicating strong statistical significance.
Asymmetry:
In contrast, positive events (pink line) exhibit a brief increase around the announcement window, but their cumulative gains quickly level off—far weaker and much less persistent than the impact of negative events.
Figure 3:Group Comparison Chart of I type events
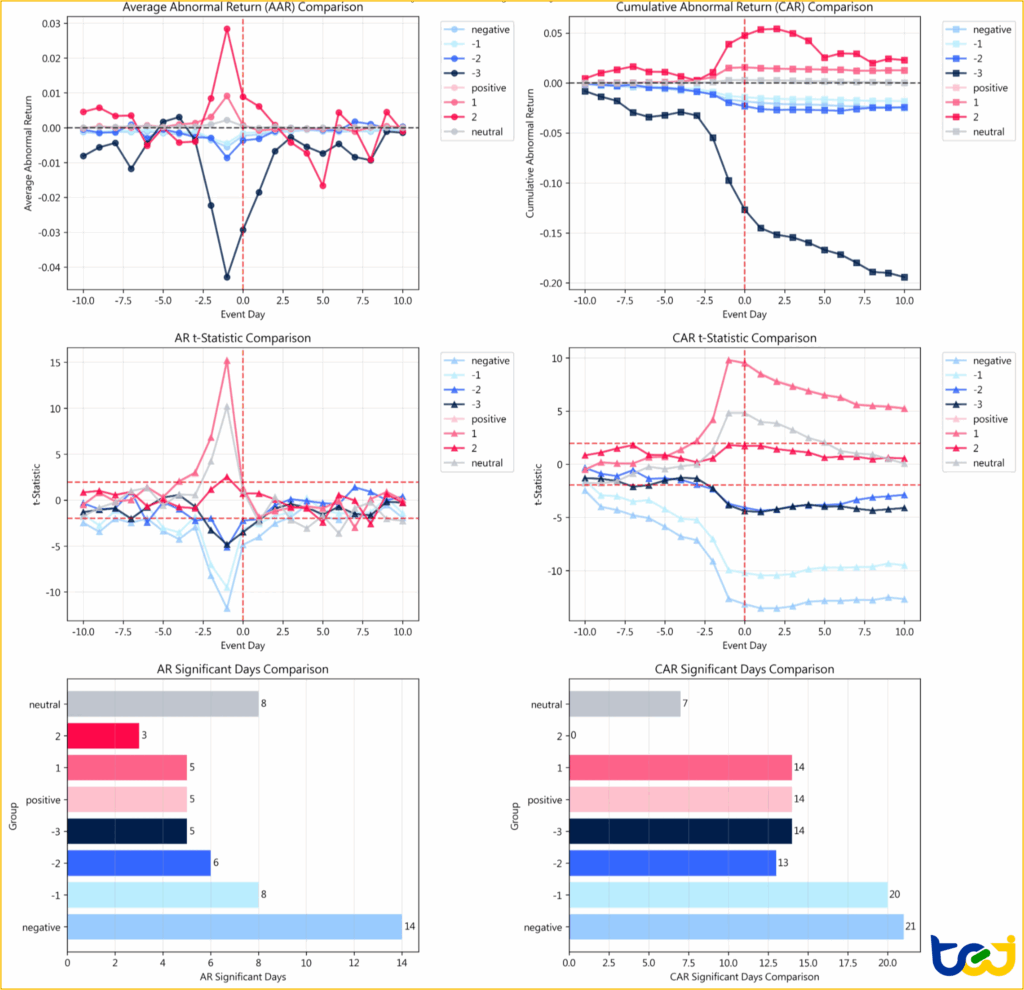
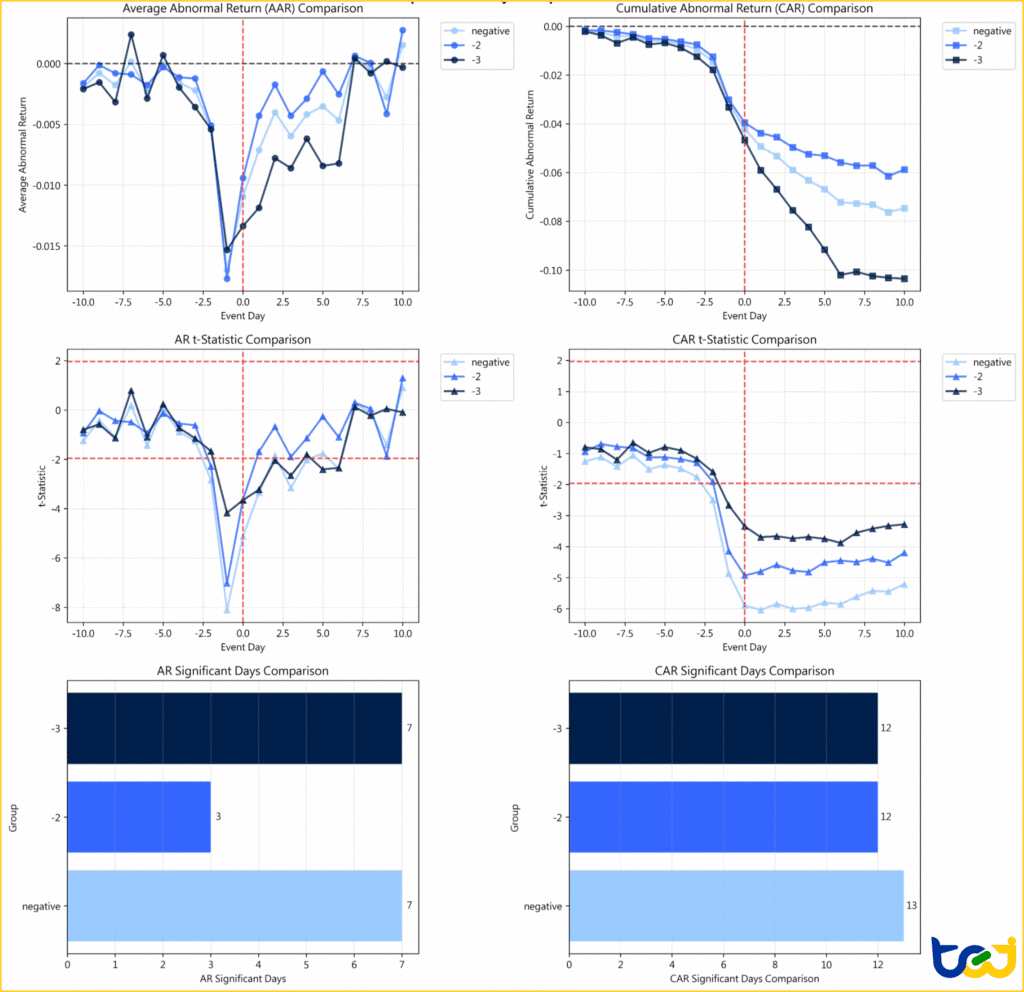
Pre-Event Drift:
The CAR chart (top-right) shows that all negative groups (negative, –2, –3) begin declining roughly three days before t=0, indicating that the market had already started pricing in the information ahead of the announcement.
Post-Event Declines (AAR):
The AAR chart (top-left) indicates that the –3 group (dark blue) experiences sharper abnormal daily losses than the –2 group (blue) during t=0 to t+6, reflecting stronger negative sentiment.
Cumulative Effect (CAR):
The –3 group shows the deepest cumulative decline, reaching about –10%, followed by the –2 group at around –6%, confirming the positive relationship between negative intensity and the magnitude of price drops.
Different Drift Patterns:
Although the –3 group falls more sharply, it bottoms out around t+5. In contrast, the –2 group declines more slowly but exhibits a longer-lasting post-event drift, continuing downward through t+10.
Statistical Significance:
The CAR t-statistic chart confirms that these declines are highly significant. All negative groups remain below –3 in t-values after the event, indicating that the negative effects are statistically robust rather than random fluctuations.
Figure 4:Group Comparison Chart of R type events

Overall, Industry Prospects (I) and Crisis Precursors (R) are the two event categories that elicit the strongest market reactions. The former reflects shocks to a company’s operating fundamentals, while the latter signals rising credit risk. These differences not only highlight the market’s layered response to different types of risk, but also demonstrate how the TCRI Watchdog classification framework accurately captures real market behavior.
This study shows that Taiwan’s market reacts quickly yet asymmetrically to corporate announcements. Negative information dominates, with impacts that begin before disclosure and persist afterward as downward drifts.
Among the five event types, Industry Prospects (I) had the most significant and lasting effects—extreme negative events (–3) led to an average cumulative drop of –19.4%, sustained through ten trading days. Crisis events (R) most closely reflected early credit deterioration, with extended tail risks.
The findings highlight a key insight:
The market reacts not only to the event itself, but to the nature and risk level of that event.
For investors, this provides a new behavioral lens—quantitatively tracking how markets price information before and after disclosures, rather than reviewing events retrospectively.
Whether constructing short-term trading models, long-term risk indicators, or portfolio surveillance systems, TCRI Watchdog’s event intensity data forms the essential behavioral layer linking information flow with market response.
👉 Get trial for Taiwan alternative data