
Table of Contents
In today’s highly real-time and information-saturated markets, news media no longer merely serve as post-hoc explanations of price movements. Instead, they have become a critical channel through which market expectations are formed and sentiment spreads. Compared with structured disclosures such as regulatory penalties or official disclosures via the Market Observation Post System (MOPS), news reports often reveal changes in corporate operations, latent risks, or emerging industry trends at an earlier stage. As a result, news is frequently regarded in practice as the earliest but most difficult-to-interpret source of information.
Given the diversity of news content and the heterogeneity of narrative framing, the key challenge investors face is not whether they should pay attention to news, but rather how to determine whether a given piece of news truly contains actionable investment signals.
TCRI Watchdog (WD) addresses this challenge by transforming highly unstructured news events into standardized and comparable event intensity scores ranging from –3 to +3, based on their potential impact on corporate credit risk. Through a systematic framework for event definition and quantification, news is converted from subjective textual narratives into analyzable and comparable quantitative data. Building on this foundation, this study applies an event study methodology to empirically examine how stock prices respond to news events of varying intensity, and to clarify the actual role that news plays in investment decision-making.
👉 Track how news moves the market with TCRI Watchdog!
In fast-moving markets, investors need more than simply knowing that an event has occurred; they require the ability to quantify its market impact in real time. TCRI Watchdog (WD) transforms unstructured textual information—including corporate disclosures, regulatory announcements, and news coverage—into observable, comparable, and traceable event signals (Event Intensity).
TCRI WD conducts daily coverage of all Taiwanese listed and OTC companies, including delisted firms, drawing from the following sources:
Each event is jointly calibrated by TEJ’s analytical team and models and assigned an event intensity score from –3 to +3 according to its potential impact on corporate credit risk. Events are further classified into 5 major dimensions and more than 100 subcategories.
Table1: 5 dimensions of TCRI Watchdog event
| Code | Event Category | Meaning |
| A | Accounting | Events related to financial reporting, accounting treatments, and disclosure practices, reflecting financial transparency and stability. |
| I | Industry | Events related to operating environment, capacity, costs, R&D progress, and financing, revealing operating momentum and industry trends. |
| M | Management | Events involving corporate governance, board and executive changes, internal or external fraud, labor disputes, information security, and internal control deficiencies, reflecting governance and management stability. |
| F | Market Trading | Events related to capital market trading, rating changes, abnormal price movements, and listing status, reflecting market perceptions of credit and liquidity. |
| R | Risk | Events involving financial distress, default, delisting, or restructuring, representing the most direct signals of credit risk. |
This framework allows investors to evaluate and compare market events using a unified standard, whether for individual stock risk monitoring or broader assessments of market risk sentiment.
👉You may also be interested in TEJ’s Factor Library , which provides standardized factor data for systematic market analysis.
Compared with highly standardized and consistently disclosed information sources, news events exhibit substantial heterogeneity in source, narrative perspective, and disclosure timing. As a result, their market impact is more difficult to anticipate ex ante. Some news merely reiterates existing information and has limited price impact, while other reports reveal operational risks, governance issues, or latent changes before formal disclosures appear, thereby acting as leading indicators of price adjustments.
This characteristic—that similar news items may carry vastly different levels of informational content—has long made news both highly scrutinized and difficult to utilize systematically in investment practice.
Because the impact of news is driven not by whether it is reported, but by the risk implications and informational intensity embedded within it, anecdotal evidence or subjective judgment alone is insufficient to determine whether news has stable predictive power. Accordingly, the core objective of this study is to place heterogeneous news events on a common, comparable scale through event-intensity quantification, and to empirically test their stock-price impact using an event study framework. Through empirical evidence, the study seeks to determine whether news functions primarily as a short-term sentiment trigger or as an information source suitable for systematic analysis.
Research Scope and Event Design
Table 2. Definition of Event Intensity Groups
| Group | Event Intensity |
| negative | <0 |
| -1 | =-1 |
| -2 | =-2 |
| -3 | =-3 |
| positive | >0 |
| 1 | =1 |
| 2 | =2 |
| 3 | =3 |
| neutral | =0 |
Event Study Design
For multi-event analysis, average abnormal returns (AAR) and cumulative average abnormal returns (CAAR) are computed to assess overall market responses to specific event intensities or categories. To further analyze the timing of market reactions, event-window effects are decomposed into pre-event, event-day, and post-event phases, with additional ratio-based and marginal-effect metrics used to evaluate the speed and structure of information absorption.
This section focuses on market reactions to news media (N-source) events, beginning with event-intensity groupings and further decomposing price reactions before and after event occurrences. It also examines whether systematic differences exist across event categories.
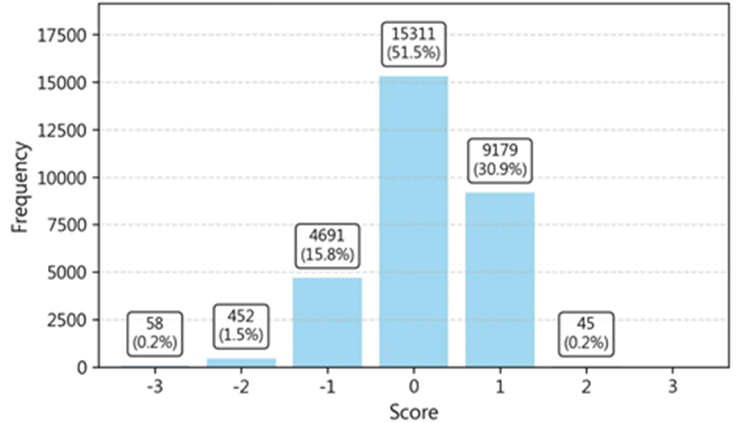
Figure 3 shows the distribution of event intensities. Neutral events (score = 0) and mildly positive events (+1) dominate the sample, accounting for 51.5% and 30.9%, respectively. Events with a score of –1 represent 15.8%. Severe negative events (–2, –3) and strongly positive events (+2 or above) together account for only about 2% of observations.
Figure3 :Event Distribution Chart
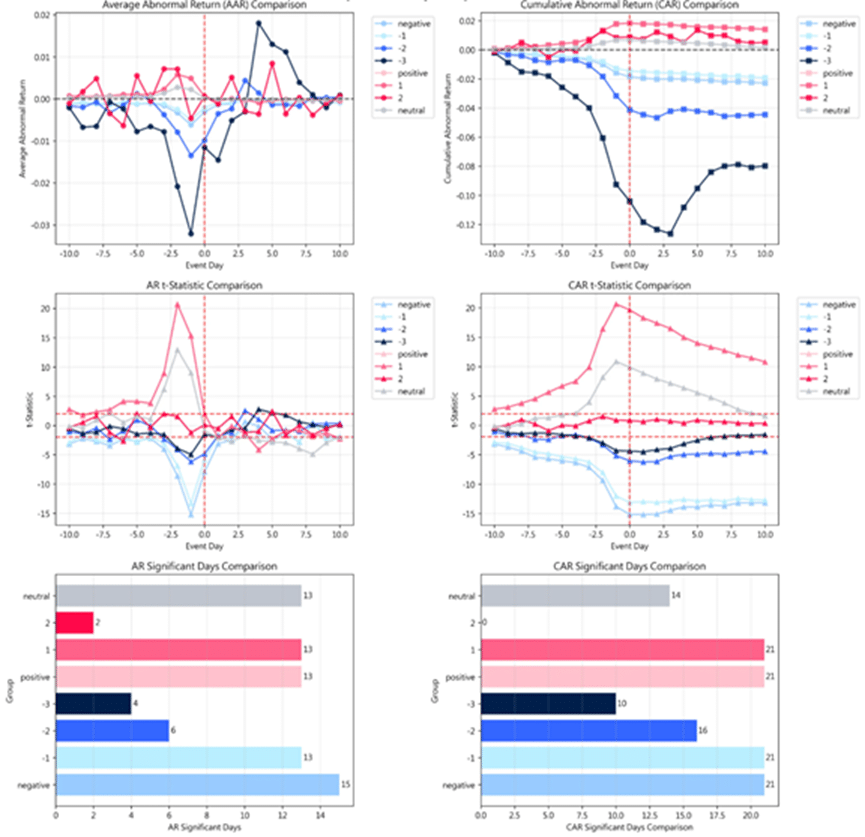
Empirical results indicate that news events exhibit clear directional effects. The final CAAR (at t+10) for negative events increases monotonically with event intensity: –1, –2, and –3 groups show final CAARs of –1.89%, –4.43%, and –7.97%, respectively. Although statistical significance for the –3 group is weaker due to limited sample size, the economic magnitude remains substantial.
Positive news generates positive market reactions, but with significantly smaller magnitudes. The +1 group shows a CAAR of approximately +1.40%, while higher-intensity positive events do not exhibit linear amplification, suggesting a more cautious market response to favorable news. Neutral events show virtually no persistent price impact, with a final CAAR of only +0.14%, indicating rapid market absorption of low-information news.
| Group | Event Count | Mean AAR (%) | Final CAAR (%) |
| -1 | 4691 | -0.09% | -1.89%*** |
| -2 | 452 | -0.20% | -4.43%*** |
| -3 | 58 | -0.38% | -7.97% |
| 1 | 9179 | 0.07% | 1.40%*** |
| 2 | 45 | 0.02% | 0.50% |
| negative | 5201 | -0.11% | -2.25%*** |
| neutral | 15311 | 0.01% | 0.14% |
| positive | 9224 | 0.07% | 1.40%*** |
Note: Mean AAR (%) : The average of the daily AAR values during the event period.
Final CAAR (%) : The CAAR value at the end of the event period (t+10).
A defining characteristic of news events is that market reactions are highly concentrated before the event date. For negative news, approximately 60–70% of the final CAAR is realized by t–1 for the –1 and –2 groups, while the –3 group exhibits pre-event reactions exceeding 100%, implying that price adjustments are largely completed before the news becomes the market’s focal point.
Event-day (t=0) marginal effects are limited, reflecting substantial information absorption in advance. Post-event reactions diverge: moderate negative events (–1 and –2) display small but persistent negative drift, whereas extreme negative events (–3) show post-event reversals, suggesting prior overreaction. Positive events exhibit similar patterns, with gains largely realized pre-event and subsequent corrections afterward. Overall, news behaves more like a leading indicator than a source of sustained post-event price discovery.
Table 5:Effect Distribution Table
| Group | CAAR(t-1)% | CAAR(t=0)% | CAAR(t+10)% | AAR(t-1)% | AAR(t=0)% | Pre% | t=0% | Post% | Marginal% | Post-Ret% |
| -1 | -1.25 | -1.43 | -1.89 | -0.47 | -0.18 | 66.2 | 9.4 | 24.4 | -62.4 | -0.46 |
| -2 | -3.14 | -4.11 | -4.43 | -1.33 | -0.97 | 70.9 | 21.8 | 7.3 | -27.1 | -0.32 |
| -3 | -9.25 | -10.39 | -7.97 | -3.20 | -1.14 | 116.0 | 14.4 | -30.4 | -64.2 | 2.42 |
| 1 | 1.77 | 1.82 | 1.40 | 0.48 | 0.05 | 126.6 | 3.6 | -30.2 | -89.6 | -0.42 |
| 2 | 0.82 | 0.86 | 0.50 | -0.48 | 0.04 | 165.4 | 7.5 | -72.9 | -107.7 | -0.36 |
| negative | -1.54 | -1.81 | -2.25 | -0.58 | -0.27 | 68.6 | 11.9 | 19.5 | -53.9 | -0.44 |
| neutral | 0.64 | 0.62 | 0.14 | 0.19 | -0.02 | 457.6 | -11.6 | -346.0 | -108.3 | -0.48 |
| positive | 1.77 | 1.82 | 1.40 | 0.48 | 0.05 | 126.6 | 3.6 | -30.2 | -89.5 | -0.42 |
Note: Pre-event weight: CAAR(t-1) / CAAR(t+10) × 100%
Event-day weight: AAR(t=0) / CAAR(t+10) × 100%
Post-event weight: [CAAR(t+10) – CAAR(t=0)] / CAAR(t+10) × 100%
Marginal reaction strength: [AAR(t=0) / AAR(t-1) – 1] × 100%
Post-event reward: CAAR(t+10) – CAAR(t=0)
Figure 6:Group Comparison Chart
Taken together, these findings demonstrate that news events do exert systematic effects on stock prices, but their impact depends critically on embedded risk intensity and timing. This raises a further question: do different types of news carry different levels of informational content? The next section (Part II) addresses this question by decomposing news events into five categories and examining cross-category differences in market impact.
👉 News matters, but not all news has the same impact. Part II breaks down the difference.
