
Table of Contents
While Part I establishes that news events generate identifiable market reactions, the informational content of news varies widely—from industry developments and financial disclosures to management changes and corporate crises. Event intensity alone is insufficient to explain these differences. Accordingly, this section decomposes news events into five categories (A, I, M, F, R) and examines whether markets respond systematically differently across news types.
👉 Missed Part I? Explore the foundational analysis of news-driven market signals here.
Event Distribution by Category
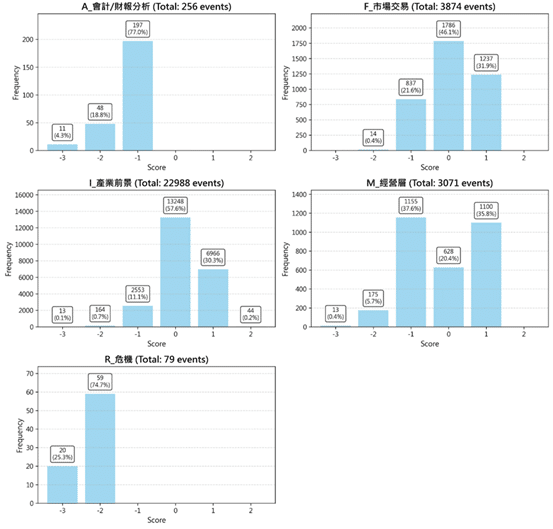
After categorizing news events into five major types (A, I, M, F, R) based on their nature, a highly uneven distribution of event volume and intensity becomes apparent.
This distribution pattern also suggests that the sheer number of events does not equate to their market impact; their informational content must be further examined in conjunction with stock price reactions.
Figure 1:Event Distribution Chart
To compare market reactions across different news types under identical event intensity, this study further cross-analyzed event categories with event intensity, using CAAR as the primary observation metric. Figure 5-4 reveals that while all event categories exhibit nearly identical negative CAAR under negative events, the magnitude of impact varies significantly. Within the same intensity group, the market reaction intensity differs markedly across event categories, indicating that the market does not react solely based on “positive or negative magnitude” but simultaneously considers the nature of the event.
Figure2:CAAR Group Comparison Chart
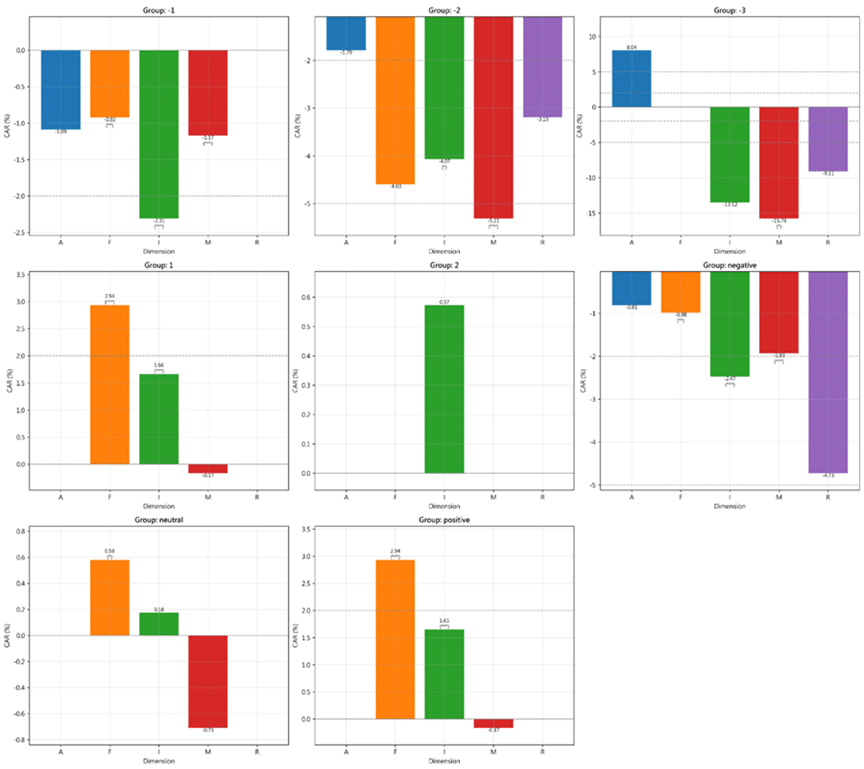
(Group: Categorized into 9 score types based on event intensity scores; Dimension: Classified into 5 major event categories)
👉You may also be interested in: TCRI Watchdog (P-type Events):
The Power of Material Disclosures — How Major Announcements Move Stock Prices
Among the five major event categories, a highly consistent monotonic relationship exists between the negative event intensity of M-class events and the magnitude of stock price declines. The final CAAR for the -3 group reached -15.78%, approximately three times that of the -2 group (-5.31%).
Table 3: Detailed Statistical Results of M Type Events
| Group | Event Count | Mean AAR (%) | Final CAAR (%) |
| -1 | 1155 | -0.05% | -1.17%*** |
| -2 | 175 | -0.25% | -5.31%*** |
| -3 | 13 | -0.75% | -15.78%** |
| 1 | 1100 | -0.01% | -0.17% |
| negative | 1343 | -0.09% | -1.93%*** |
| neutral | 628 | -0.03% | -0.71% |
| positive | 1100 | -0.01% | -0.17% |
In contrast, Industry Outlook (I-type) and Crisis (R-type) news also exhibit a consistent negative impact, though neither in significance nor persistence do they match the intensity of M-type events. Market transaction-related (F-type) news, however, exhibited relatively prominent performance in positive events. This reflects that information related to transactions and liquidity is more readily perceived as short-term positive catalysts. Yet, its effects were largely priced in before the announcement, with a Pre-event Ratio as high as 86.3% and a Post-Event Return of only 0.28%, lacking long-term sustainability.
Table4:Effect Distribution Table of F Type Events
| Group | CAAR(t-1)% | CAAR(t=0)% | CAAR(t+10)% | AAR(t-1)% | AAR(t=0)% | Pre% | t=0% | Post% | Marginal% | Post-Ret% |
| -1 | -1 | -1.13 | -0.92 | -0.4 | -0.13 | 108.7 | 13.8 | -22.5 | -68.2 | 0.21 |
| -2 | -3.8 | -3.94 | -4.6 | -0.33 | -0.15 | 82.6 | 3.2 | 14.2 | -55.2 | -0.65 |
| 1 | 2.53 | 2.66 | 2.94 | 0.39 | 0.12 | 86.3 | 4.2 | 9.4 | -67.9 | 0.28 |
| negative | -1.05 | -1.17 | -0.98 | -0.4 | -0.13 | 106.7 | 12.9 | -19.6 | -68 | 0.19 |
| neutral | 0.5 | 0.46 | 0.58 | -0.02 | -0.04 | 86.4 | -6.6 | 20.3 | 61.5 | 0.12 |
| positive | 2.53 | 2.66 | 2.94 | 0.39 | 0.12 | 86.3 | 4.2 | 9.4 | -67.9 | 0.28 |
Management-related events also show strong pre-event reactions, but with more pronounced post-event adjustments than other categories, suggesting slower market digestion of governance-related risks.
Table 5:Effect Distribution Table of M Type Events
| Group | CAAR(t-1)% | CAAR(t=0)% | CAAR(t+10)% | AAR(t-1)% | AAR(t=0)% | Pre% | t=0% | Post% | Marginal% | Post-Ret% |
| -1 | -0.67 | -0.75 | -1.17 | -0.32 | -0.08 | 57.4 | 6.6 | 36.0 | -76.0 | -0.42 |
| -2 | -2.85 | -3.39 | -5.31 | -0.61 | -0.54 | 53.7 | 10.1 | 36.2 | -12.8 | -1.93 |
| -3 | -11.58 | -13.31 | -15.78 | -6.21 | -1.73 | 73.4 | 10.9 | 15.7 | -72.2 | -2.47 |
| 1 | 0.18 | 0.19 | -0.17 | 0.04 | 0.00 | -111.1 | -0.8 | 211.8 | -96.6 | -0.35 |
| negative | -1.10 | -1.27 | -1.93 | -0.42 | -0.17 | 56.8 | 8.8 | 34.4 | -59.8 | -0.67 |
| neutral | 0.21 | 0.09 | -0.71 | 0.20 | -0.12 | -30.0 | 17.4 | 112.7 | -163.1 | -0.80 |
| positive | 0.18 | 0.19 | -0.17 | 0.04 | 0.00 | -111.1 | -0.8 | 211.8 | -96.6 | -0.35 |
Analysis of event categories and intensity reveals that news events indeed hold investment reference value, but the key lies not in the news itself, but in the event type to which it belongs. News related to management and governance carries the highest information content and market impact; in contrast, industry and transaction-related news tends to influence short-term sentiment or serve as information updates.
Using event study methodology, this research systematically examines whether news media events in the TCRI Watchdog database generate identifiable and structured market reactions. The results demonstrate that news does contain investment signals, but their effectiveness depends critically on risk intensity and event type. Negative news shows clear directional effects, with stronger intensity leading to larger price declines. Compared with regulatory announcements or material disclosures, news reactions are more front-loaded and more prone to post-event correction, underscoring their role as leading rather than persistent information.
Further category analysis confirms that not all news is equally informative. Management and governance-related news carry the highest informational content and market impact, while industry and trading news is often absorbed quickly and must be interpreted in conjunction with event intensity and timing.
Ultimately, the key to incorporating events into investment decision-making lies not in the volume of information, but in the ability to transform heterogeneous events into comparable, back-testable, and verifiable quantitative data. TCRI Watchdog provides such a framework by systematically integrating news, exchange disclosures, and regulatory information into a unified event-intensity system, enabling investors to analyze market behavior from an event-based perspective and integrate it with fundamentals, quantitative factors, and risk-management models.
