Table of Contents
Since the advent of numerous AI-related applications in 2023, the market’s attention to the technology industry has intensified. Stocks in the information and communication technology sector, such as Wistron and Quanta, have seen significant price increases, delighting shareholders but causing most investors to hesitate, fearing they might buy high and sell low and get stuck at relatively high prices. This article attempts to identify stocks that have yet to catch the market’s attention but are gradually rising in price and to conduct a backtesting analysis on this composite factor.
When market efficiency is low or inefficient, stock prices tend to overreact or underreact to new information. This phenomenon allows investors to achieve significant positive average returns by buying stocks that have performed well in the past or short-selling stocks that have performed poorly (Jegadeesh and Titman, 1993). From a behavioral finance perspective, George and Hwang (2004) pointed out that traders might be reluctant to buy even if there is favorable news when stock prices approach a new high within the past year. This reluctance leads to stock prices reaching new highs driven by positive news, indicating that even professional investors might underreact to new information. Zhang (2006) found from an information asymmetry perspective that in markets with a higher degree of information asymmetry, future returns of stocks following bad or good news tend to be lower or higher, respectively. Momentum strategies perform better in stocks with higher levels of information asymmetry.
This study attempts to use the daily reports of brokers branches trading provided by the Taiwan Stock Exchange to derive relevant indicators from an information asymmetry perspective, combining these with momentum factors to identify stocks that have yet to catch the market’s attention but are gradually rising in price. The study will conduct overlapping period tests, IC/IR value tests, and factor portfolio backtesting on this composite factor.
Data source and sample period
The data used in this study, including company financial reports, adjusted closing prices, monthly revenues, and the net buy/sell details of FINI/Major Brokers Branches trading, were all sourced from the Taiwan Economic Journal (TEJ) database. To enhance the effectiveness of factor testing and minimize the discrepancy between research and practical operations, this study excludes stocks with prices below NT$10 during the rebalancing period, stocks with zero trading volume, stocks listed for less than one year, and stocks announced as fully delivered or suspended from trading during the rebalancing period.
Due to the complexity of brokerage branch data, the sample period for this study spans three years, from January 2021 to January 2024. The dataset includes 1,019 stocks listed and delisted on the Taiwan Stock Exchange. Although the sample period is relatively short, it covers significant events such as the local COVID-19 outbreak in Taiwan in May 2021 and the Federal Reserve’s interest rate hike cycle starting in March 2022. These events provide a substantial reference value for the subsequent analysis of strategy robustness.
For more information on the definition of IC/IR, please refer to Stock Selection Factors Research: Combining Insider Ownership and Momentum Factors “
This study references the methodologies of Jegadeesh and Titman (1993) and Lee and Swaminathan (2000), using monthly intervals for portfolio formation and holding periods. The formation period calculates the price momentum factor, the standardized unexpected revenue, and the recent monthly concentration of flow distribution indicators. The holding periods are fixed at 1, 3, 6, 9, and 12 months.
The first trading day of each month marks the portfolio rebalancing time, where the next period’s portfolio is constructed based on the factor values calculated during the formation period. The momentum factor is divided into five groups (M1 to M5), with M1 being the loser portfolio and M5 being the winner. The brokerage branch factors are divided into three groups (C1 to C3), and the interaction of these factors forms 15 composite factor combinations (e.g., M1C1, M1C2…M5C3). Following Lee and Swaminathan (2000), this study designates M1C3, the group with the lowest momentum factor and the highest brokerage branch factor, as the loser portfolio. Conversely, M5C1 is the winner portfolio, with the highest momentum factor and the lowest brokerage branch factor. A long-short portfolio is formed by buying the winner portfolio and selling the loser portfolio.
This study adopts an overlapping period method to construct portfolios to enhance the power of the tests and analyze the persistence of factors. Each month, multiple portfolios are held simultaneously based on different holding periods, with equal weight assigned to each portfolio. This study equally weights the brokerage branch factor and the momentum factor, ranking stocks in ascending order based on the brokerage branch factor (lower factor values rank higher) and descending order based on the momentum factor (higher factor values rank higher). The average of these rankings forms the composite factor used to rank stocks in period T. The highest-ranked stocks have the highest momentum factor values and the lowest brokerage branch factor values, and vice versa.
The study forms portfolios based on factor values for backtesting. This not only allows for further analysis of the factors’ monotonicity but also assesses their robustness when encountering systemic risk. Subsequent analysis will separately examine the performance of portfolios composed using the momentum and composite factors. This analysis aims to determine whether the brokerage branch factor can enhance the returns of the momentum factor while also reducing the high volatility typically associated with the momentum factor.


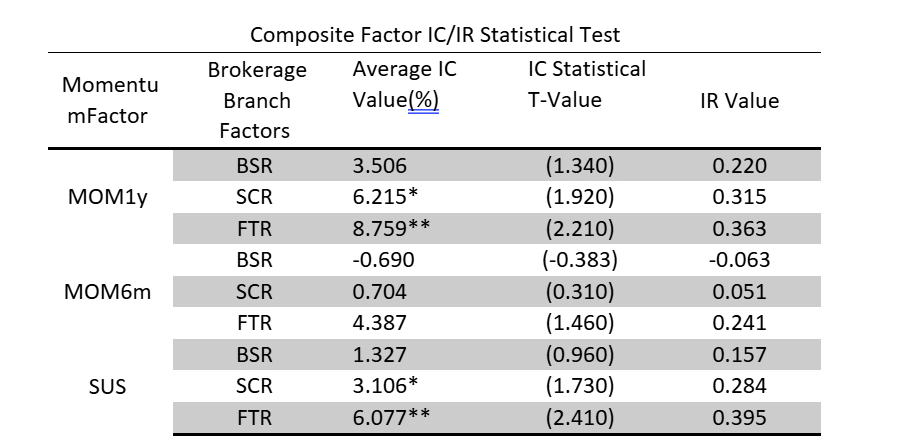
The two tables above show that in the IC/IR value tests for pure momentum factor portfolios, the momentum factor of reaching a new high in the past year has the best predictive ability. However, when examining the composite factors formed by various momentum factors and brokers branches trading, it is evident that the composite factor incorporating the Popularity of Branch Trading (FTR) most significantly enhances the predictive ability of the pure momentum factor. This indicates that using the Popularity of Branch Trading combined with various momentum factors can dramatically improve the ability to predict next month’s stock returns and enhance these predictions’ stability.
In terms of annualized returns, all three momentum factors exhibit a good monotonic increasing trend, with the M5 portfolio showing the highest returns and the M1 portfolio showing the lowest. However, volatility increases along with the returns for the six months and the standardized unexpected monthly revenue momentum factor portfolios. Only the momentum factor of reaching a new high in the past year demonstrates a decrease in annualized volatility and Beta value while increasing returns.
Regarding composite indicators, the M5 portfolio of the momentum factor reaching a new high in the past year has a Sharpe ratio of 1.372, the best performance among all M5 portfolios. This is mainly due to its lower volatility rather than higher portfolio returns. For long-short portfolios, the W-L portfolio composed of the standardized unexpected monthly revenue factor performs the best among all momentum factor portfolios, with a Sharpe ratio of 2.143 and a maximum drawdown of only 7.85%. This indicates that using this factor can most stably select the stocks that will rise and fall next month.
First, from the composite results of the momentum factor reaching a new high in the past year, the Popularity of Branch Trading shows the best performance. Although the net return of the M5C1 portfolio is lower than the best combinations of other composite factors, its annualized volatility is only 7.99%, with a maximum drawdown of only 9.73%, leading to an annualized Sharpe ratio of 2.468. This composite factor is more outstanding than the pure momentum factor’s M5 portfolio and the benchmark index during the same period. This indicates that using the Popularity of Branch Trading to select stocks that have reached a new high in the past year can identify stocks that can continue to grow steadily, maintaining high returns while effectively reducing high volatility.
For the six-month momentum factor, the composite factor of the Popularity of Branch Trading also performs the best. The M5C1 portfolio achieves a net return of 114.84%, the highest among all composite factor portfolios, while its volatility decreases by 5.6% compared to the pure momentum factor’s M5 portfolio, down to 17.25%, significantly improving the annualized Sharpe ratio from 0.9 to 1.575. The maximum drawdown also decreases from 24.1% to 19.54%. This indicates that using the Popularity of Branch Trading to select the winners of the past six months can identify stocks with the potential for significant growth, greatly improving returns while reducing excessive volatility.
Finally, the composite results of the standardized unexpected monthly revenue momentum factor also show that the Popularity of Branch Trading performs the best. The net return of the M5C1 portfolio slightly increases from the pure momentum factor’s 85.57% to 90.30%, while annualized volatility drops significantly from 18% to 11.23%, leading to an increase in the annualized Sharpe ratio from 1.243 to 1.98. This indicates that using the Popularity of Branch Trading to select stocks based on the standardized unexpected monthly revenue momentum factor not only slightly improves returns but also significantly reduces volatility, thereby enhancing the portfolio’s annualized Sharpe ratio and instilling confidence in its performance.
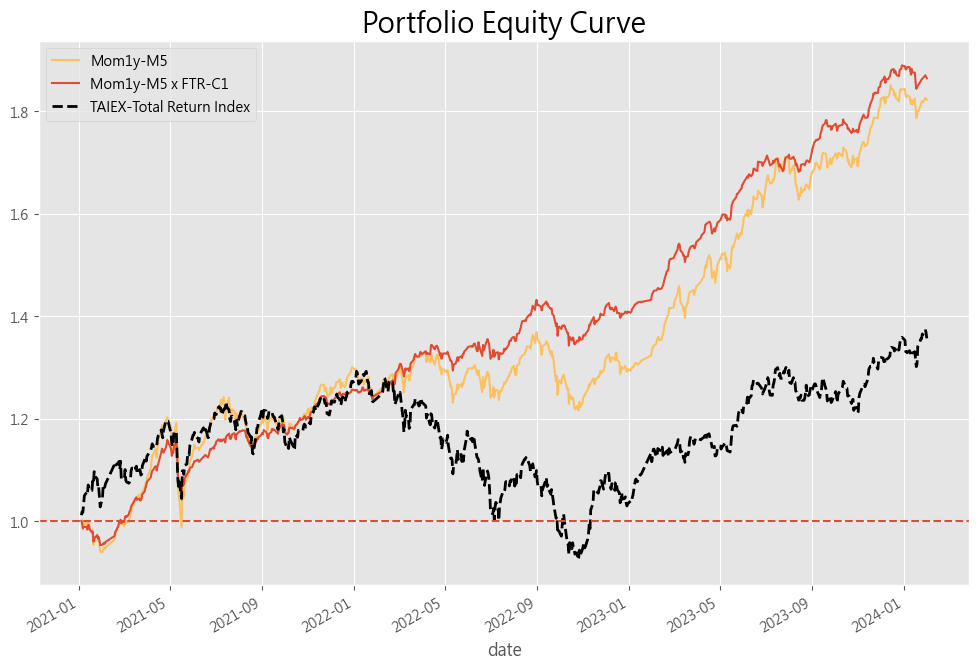
Below is a comparison chart of the return curves for the M5 portfolio and the M5C1 portfolio. It can be observed that the M5C1 portfolio has both lower volatility and higher returns compared to the M5 portfolio.

This study uses indicators derived from brokerage branch data, including the Net Buy-Sell Branch Ratio, Popularity of Branch Trading, and Recent Monthly Concentration of Flow Distribution, combined with three academically common momentum factors to form composite factors. These combinations create 15 groups, attempting to identify winner stocks that have not yet attracted market attention but are gradually rising, similar to the low-volume winner portfolios proposed by Lee and Swaminathan (2000).
After performing overlapping period tests, IC/IR value analyses, and factor portfolio backtesting, it was found that the composite factors formed by combining the Popularity of Branch Trading with various momentum factors are the most effective in identifying low-volume winner portfolios. These composite factors significantly improve the returns and persistence of the original momentum factors and enhance their predictive ability (IC) and stability (IR). In portfolio backtesting, they also significantly reduce volatility. Among these, the M5C1 combination has the highest momentum factor and the lowest brokerage branch factor and is the best performer.
Backtesting the period from January 2021 to January 2024, which includes the domestic COVID-19 outbreak and the Federal Reserve’s rate hike cycle, shows that the net return trend of the M5C1 portfolio remains steadily upward, with a net return of 78.2%. The annualized volatility is only 7.99%, driving the portfolio’s Sharpe ratio to 2.468. The maximum drawdown during this period is only 9.73%. Compared to the Taiwan Weighted Stock Index during the same period, the M5C1 portfolio achieves an excess return (Alpha) of 17.3%, with a volatility (Beta) of only 32.5%. These findings could inspire new strategies in stock market analysis and portfolio management based on employee Popularity of Branch Trading and momentum factors. For more details of brokers’ branches trading, welcome to contact TEJ for further introduction or visit our database.
Start Building Portfolios That Outperform the Market!
F-score Strategy: Identifying Undervalued Quality Stocks )
Trend-Following Strategy: A Trading Method Used by Fund Managers )

Subscribe to newsletter